 Last week, I attended the IALP 2016 conference (20th International Conference on Asian Language Processing) in Taiwan. After the conference, each presenter received a u-disk with all accepted papers in PDF format. So when I got back to Beijing, I began going through the papers to extend my learning. Usually, when I return from a conference, I go through all paper titles and my conference notes, then choose the most interesting articles and dive into them for details. I’ll then summarize important research discoveries into one document. This always takes me several days or more to complete.
This time, I decided to try SAS Text Analytics to help me read papers efficiently. Here’s how I did it.
My first experiment was to generate a word cloud of all papers. I used these three steps.
Step 1: Convert PDF collections into text files.
With the SAS procedure TGFilter and SAS Document Conversion Server, you may convert PDF collections into a SAS dataset. If you don’t have SAS Document Conversion Server, you can download pdftotext for free. Pdftotext converts PDFfiles into texts only, you need to write SAS code to import all text files into a dataset. Moreover, if you use pdftotext, you need to check if the PDF file is converted correctly or not. It’s annoying to check texts one by one and I hope you look for smart ways to do this check. SAS TGFilter procedure has language detection functionality and language of any garbage document after conversion is empty rather than English, so I recommend you use TGFilter, then you can filter garbage documents out easily with a where statement of language not equal to ‘English.’
Step 2: Parse documents into words and get word frequencies.
Run SAS procedure HPTMINE or TGPARSE against the document SAS dataset, with stemming option turned on and English stop-word list released by SAS, you may get frequencies of all stems.
Step 3: Generate word cloud plot.
Once you have term frequencies, you can either use SAS Visual Analytics or use R to generate word cloud plot. I like programming, so I used SAS procedure IML to submit R scripts via SAS.
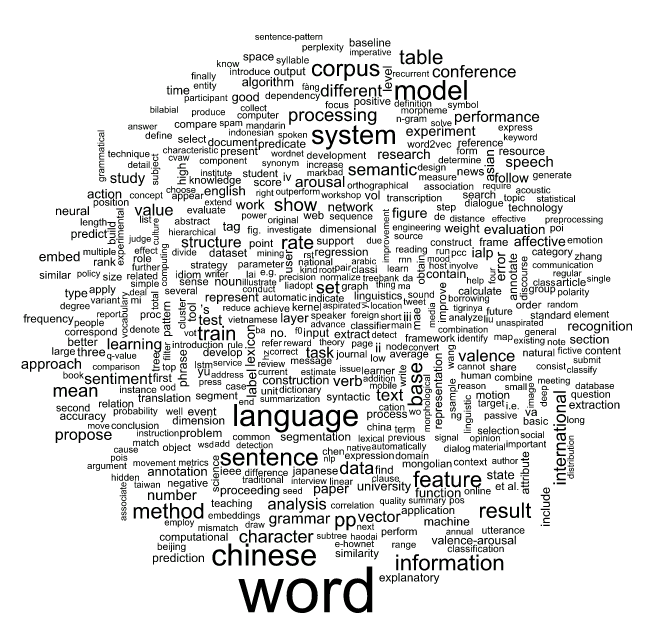
These steps generated a word cloud with the top 500 words of 66 papers. There were a total of 87 papers and 21 of them could not be converted correctly by SAS Document Conversion Server. 19 papers could not be converted correctly by pdftotext.

From figure-1, it is easy to see that the top 10 words were: word, language, chinese, model, system, sentence, corpus, information, feature and method. IALP is an international conference, and does not focus on Chinese only. However there was a shared task at this year’s conference, and its purpose is to predict traditional Chinese affective words’ valance and arousal ratings. Moreover, each team who had attended the shared task was requested to submit a paper to introduce their work, so “Chinese” contributed more than other languages in the word cloud.
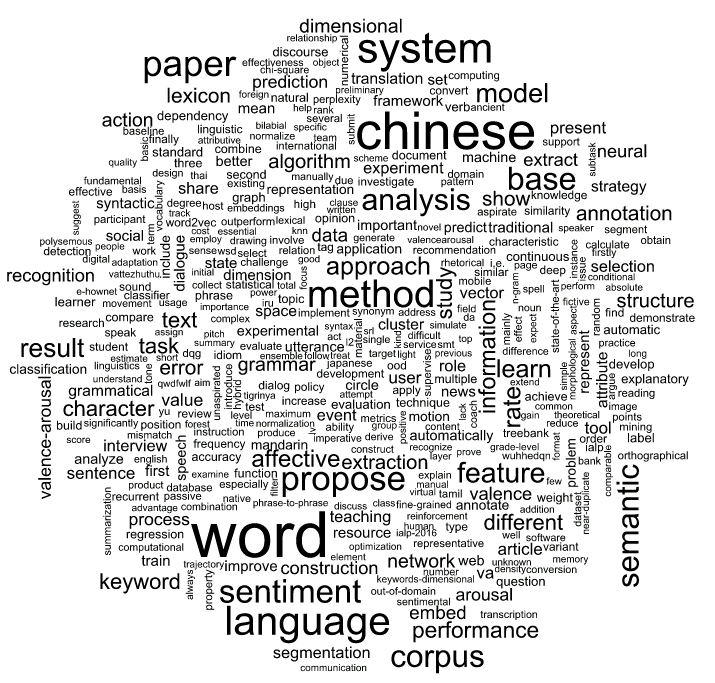
You probably think there’s a lot of noise if we use paper bodies to do word cloud analysis, so my second experiment is to generate word cloud of paper abstracts through similar processing. You can view these results in Figure-2.

The top 10 words from the paper abstracts were: word, chinese, system, language, method, paper, propose, sentiment, base and corpus. These are quite a bit different from top 10 words extracted from paper bodies. Character, word and sentence are fundamental components of natural languages. For machine learning in NLP (natural language processing), annotated corpus is the key. Without corpus, you cannot build any model. However, annotated corpus is very rare even in big data era and that is why so many researchers pay efforts in annotation.
Can we do more analyses with SAS? Of course. We may analyze keywords, references, paper influence, paper categorization, etc. I hope I have time to try these interesting analyses and share my work with you in a future blog.
The SAS scripts for paper word cloud as below.
* Step 1: Convert PDF collections into sas dataset; * NOTE: You should have SAS Document Converte purchased; proc tgfilter out=paper(where=(text ne '' and language eq 'English')) tgservice=(hostname="yourhost" port=yourport) srcdir="D:\temp\pdf_collections" language="english" numchars=32000 extlist="pdf" force; run;quit; * Step 2: Parse documents into words and get word frequencies; * Add document id for each document; data paper; set paper; document_id = _n_; run; proc hptmine data=paper; doc_id document_id; var text; parse notagging nonoungroups termwgt=none cellwgt=none stop=sashelp.engstop outparent=parent outterms=key reducef=1; run;quit; * Get stem freq data; proc sql noprint; create table paper_stem_freq as select term as word, freq as freq from key where missing(parent) eq 1 order by freq descending; quit; * Step 3: Generate word cloud plot with R; data topstems; set paper_stem_freq(obs=500); run; proc iml; call ExportDataSetToR("topstems", "d" ); submit / R; library(wordcloud) # sort by frequency d <- d[order(d$freq, decreasing = T, ] # print wordcloud; svq(filename="d://temp//wordcloud_top_sas.svg", width=8, height=8) wordcloud(d$word, d$freq) dev.off() endsubmit; run;quit; |

4 Comments
Impressive!
Robert, thank you for your comment. I learned a lot about sas/graph from your sharing!
This is a great post! It would be cool to see a conference search engine that would let you click each word in the cloud to see more stats, and list papers by number of occurrences, etc.
Nice suggestion! Thank you, Paul.