If your SAS Visual Analytics report requirements include linking out to separate reports without the need to pass values, you may want to consider using images to enhance the appearance of your base report. Here are three style examples using images that you can use depending on your report design requirements and report user preference:
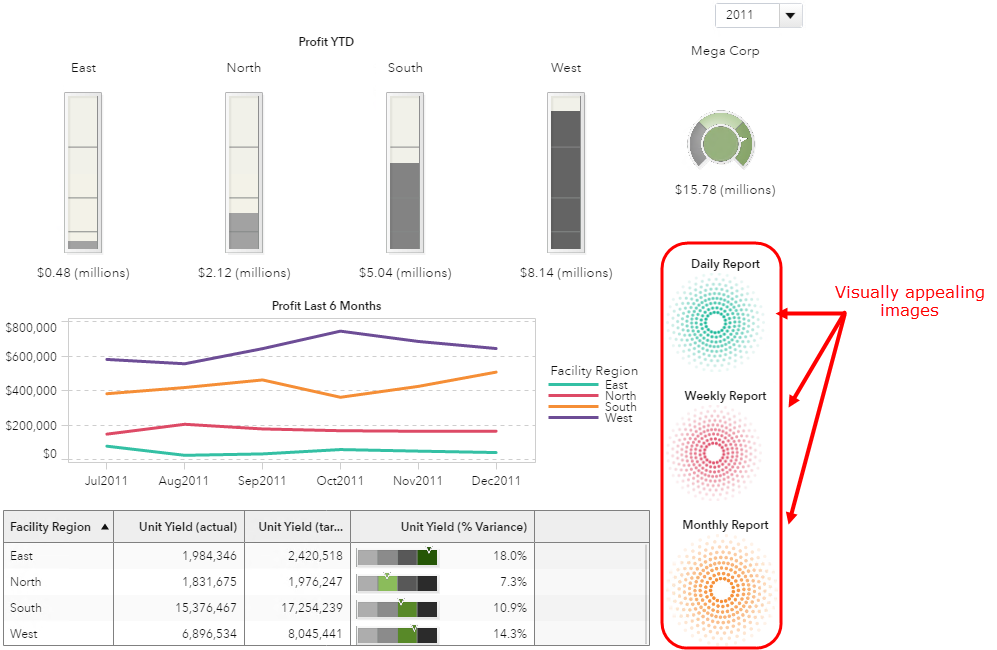
1. Visually appealing
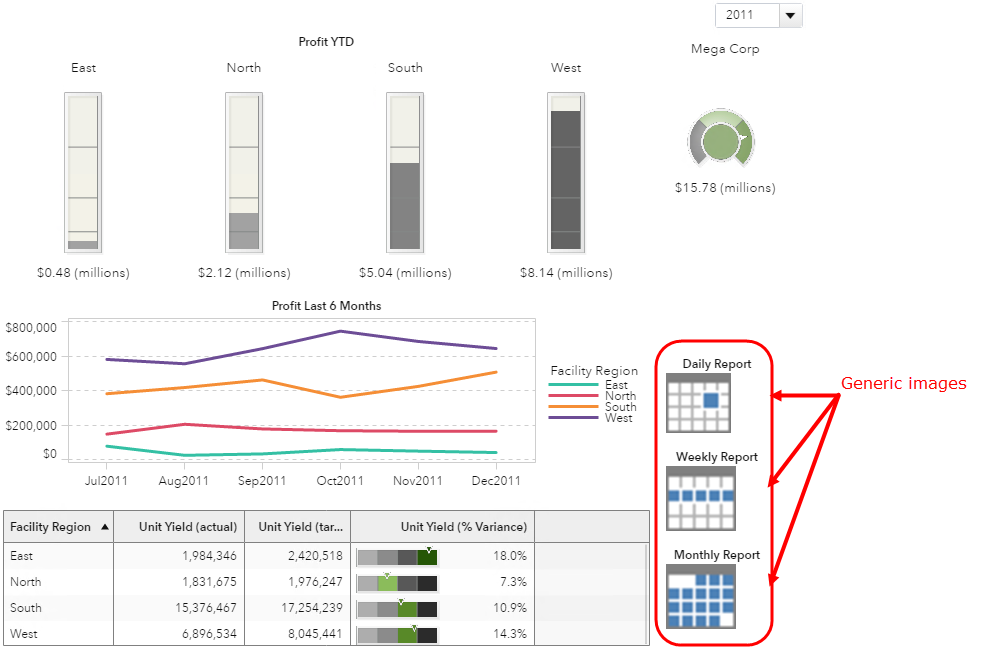
2. Generic
3. Screenshot of actual report.
There is no better substitute for looking at examples so here are some screenshots for you:
1. Visually appealing
2. Generic
3. Screenshot of actual report
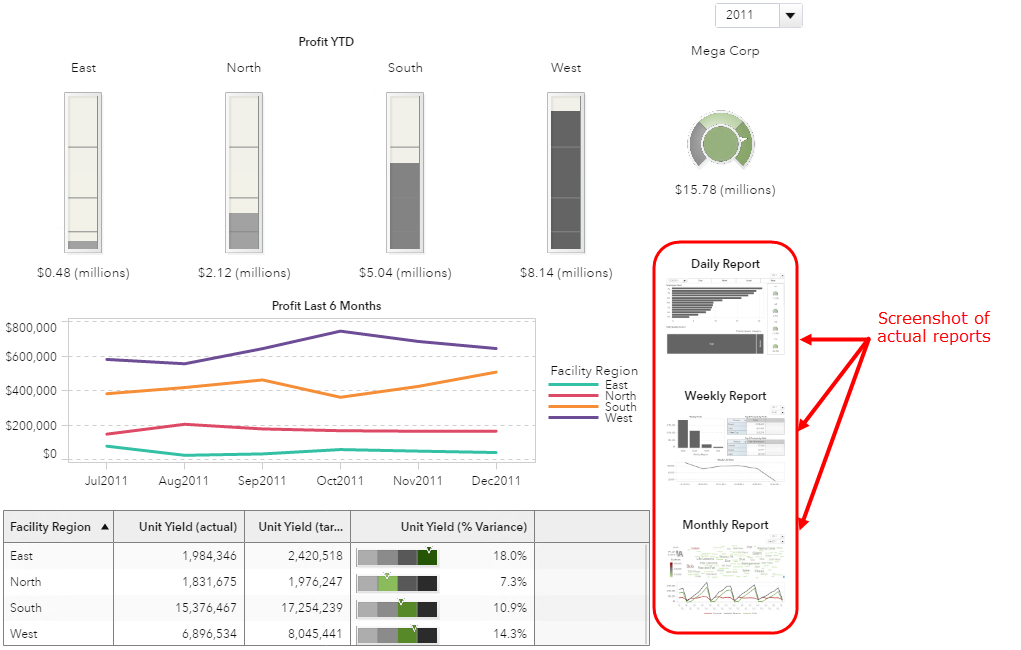
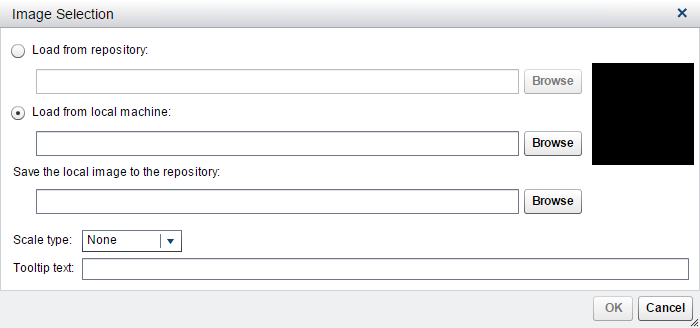
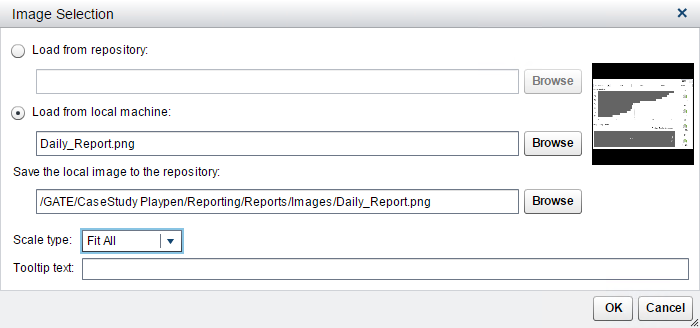
Image selection
Using an image in your report has never been easier. You can navigate your local machine for the image and, if you want, you can also save the image in metadata. This allows other users with access to that metadata location the ability to use the same image. This is great when you want to impose consistency throughout your reports.
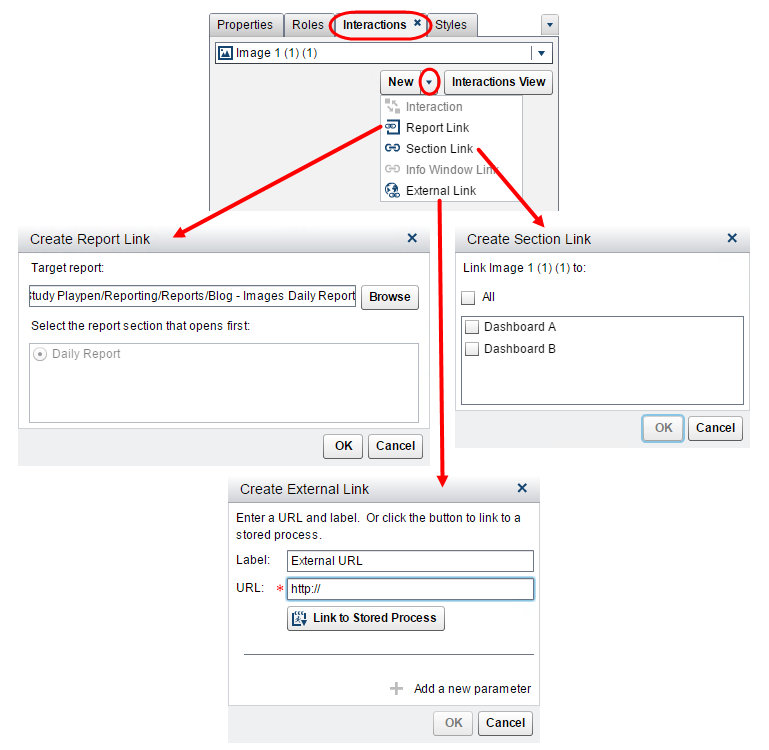
Setting link using image
To define a report link from your image, click on your image then open the Interactions tab. Then use the New drop-down menu and select the type of link you wish to define. For a Report Link or Section Link, use the Browse button to navigate the metadata and select your target. If you are linking to an External URL then enter the fully qualified URL or you can define a link to a stored process.
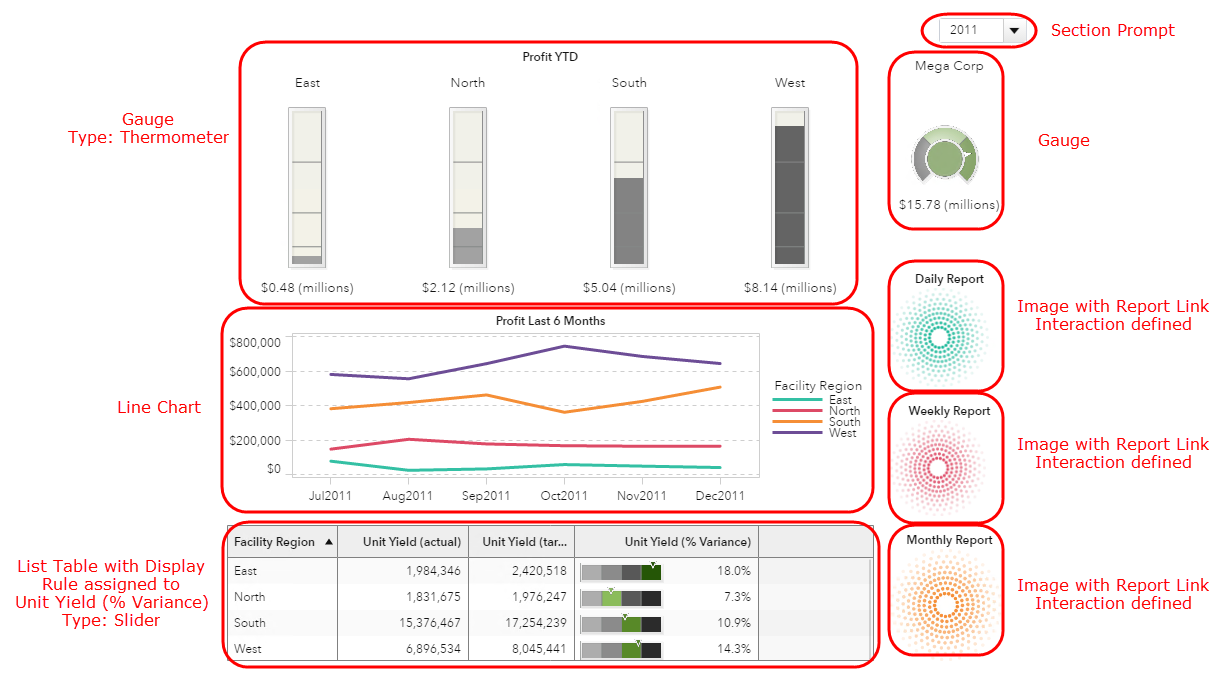
Here is a breakdown of the report objects used in the main dashboard report. I also included the screenshots of my Daily, Weekly, and Monthly report examples.
Dashboard example breakdown
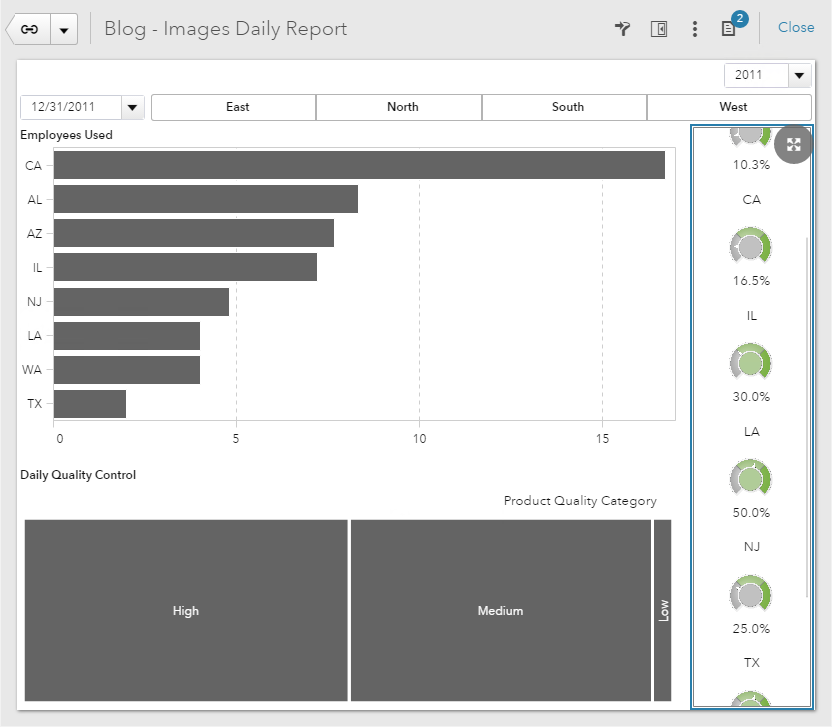
Daily report example
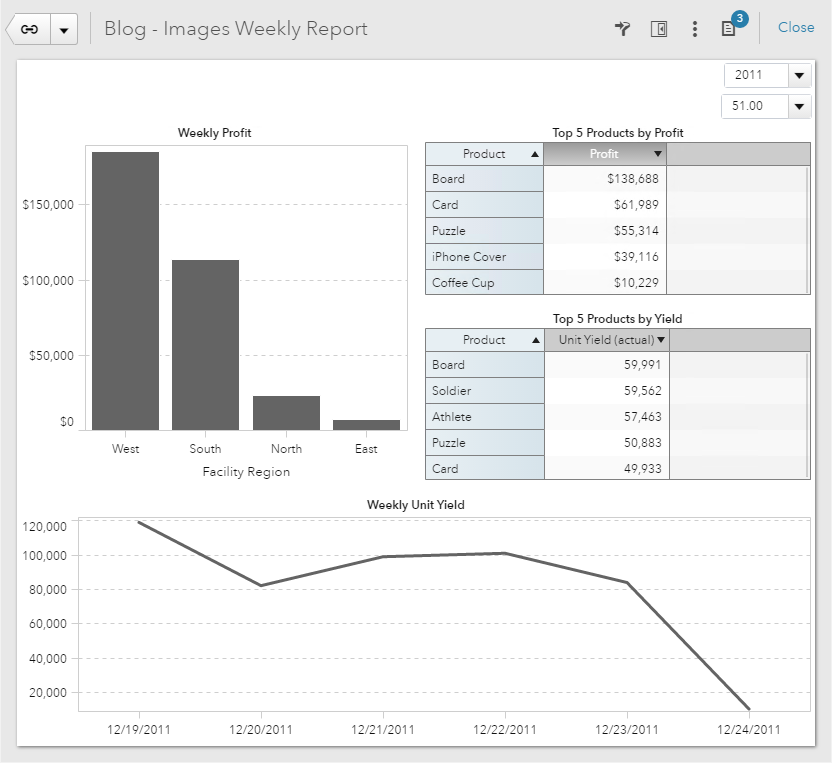
Weekly report example
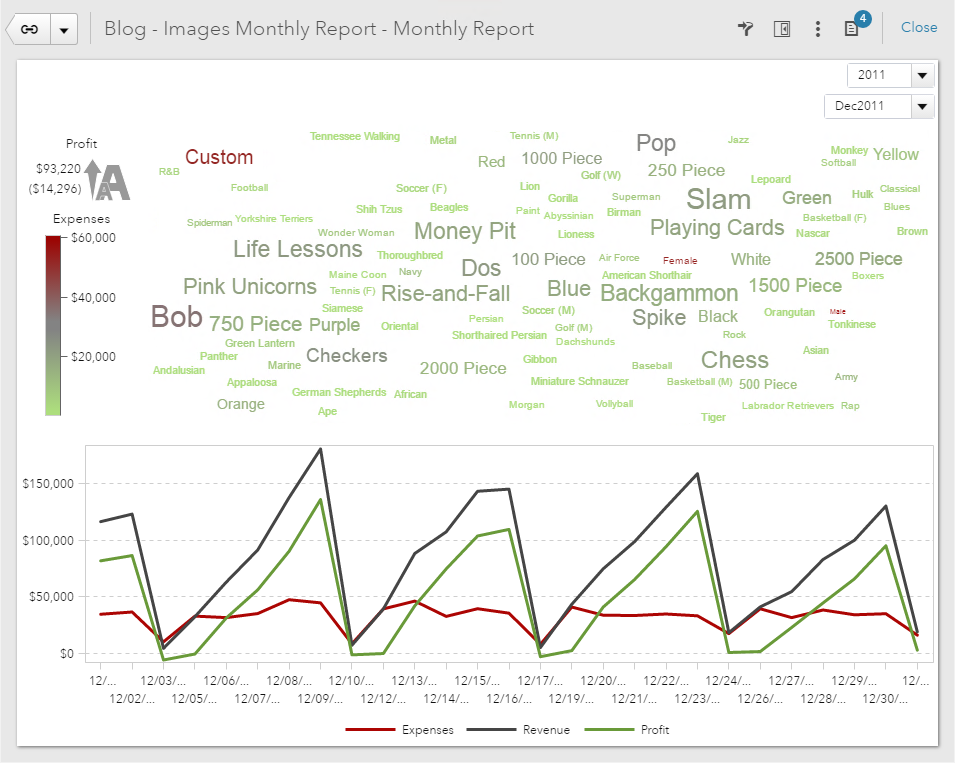
Monthly report example

3 Comments
Thanks for confirming Teri...
Can the screenshot of actual report be a dynamic thumbnail or a report or is it a static screenshot that is saved as described above?
Hi Michelle,
The screenshot needs to be a static image. As of now, we do not allow for a dynamic thumbnail.