Reference lines on a visualization are used to help identify goals or targets, acceptable or unacceptable ranges, etc; basically any metric that puts a frame of reference around the values on the visualization.
The Percent of Total of a metric is used to help identify a part-to-whole relationship. It answers the question, how much of the whole does this piece represent?
In this blog, let’s take a look at how you can use both the Percent of Total metric and Reference Lines to enhance your data visualizations using SAS Visual Analytics.
Example 1
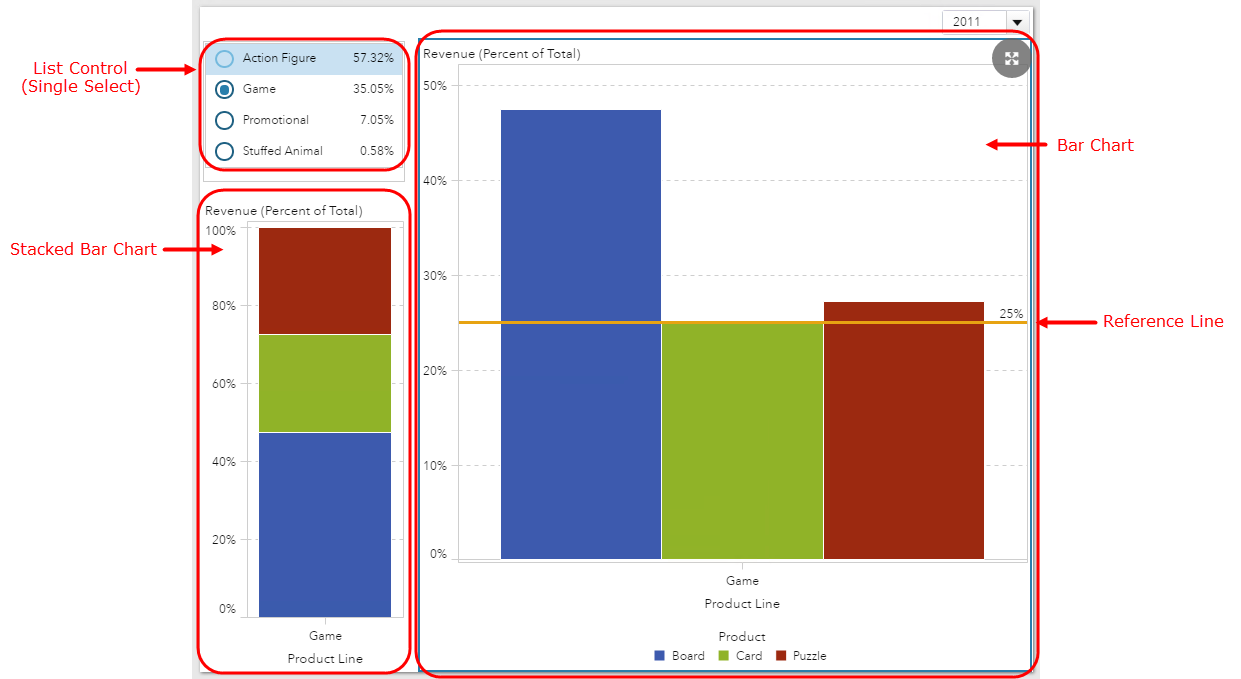
In this section, we are reporting on the Percent of Total for Revenue. First, look at the single select List control object. You’ll see I have displayed the available Product Lines and their corresponding frequency percent. This allows the report viewer to quickly understand the number of rows associated with that Product Line when compared to the whole of the data.
Next, under the List control object, we have a Stacked Bar Chart graphing the Revenue (Percent of Total) which allows the report viewer to understand the part-to-whole relationship of the Products that make up that Product Line. While we can clearly see that the Board Product, colored in blue, is outperforming the other two Products, it may be difficult to tell which remaining Product is pulling in the higher Revenue.
The Grouped By Bar Chart in the middle of the report can be used to quickly compare the performance of each Product. I added a reference line so that the report viewer can quickly identify which Products are pulling in more than 25% of the Revenue for that Product Line.
Here are some additional views from this report:
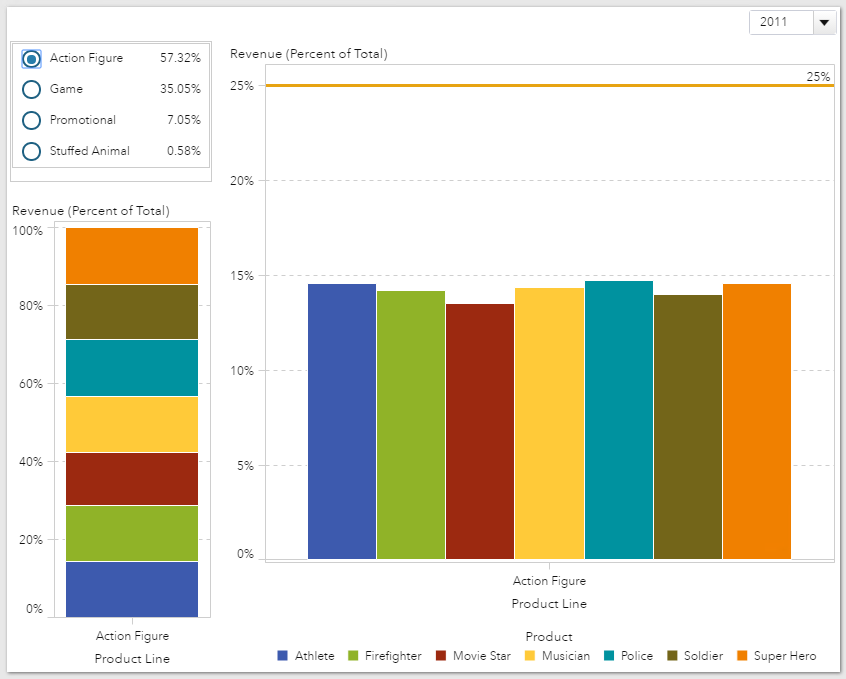
In this view, we have selected the Action Figure Product Line and it makes up 57.32% of the Frequency Percent. We can see that not one individual Product in the Action Figure Product Line reaches 25% of the Revenue’s Percent of Total and that they are all hovering near 15%. By using the Revenue (Percent of Total) metric all of the data is normalized and the static reference line allows for quick and easy comparison over all of the Product Lines.
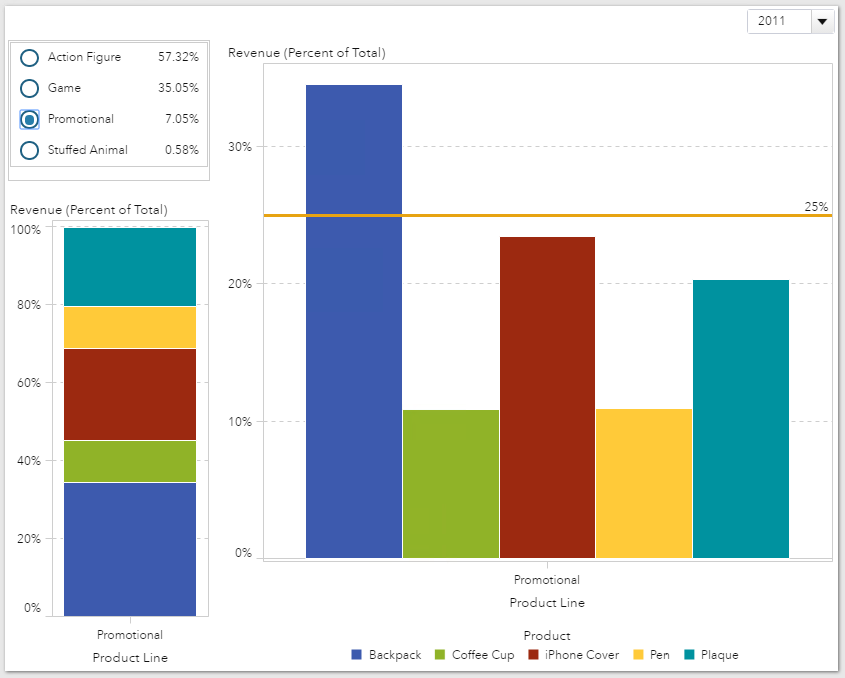
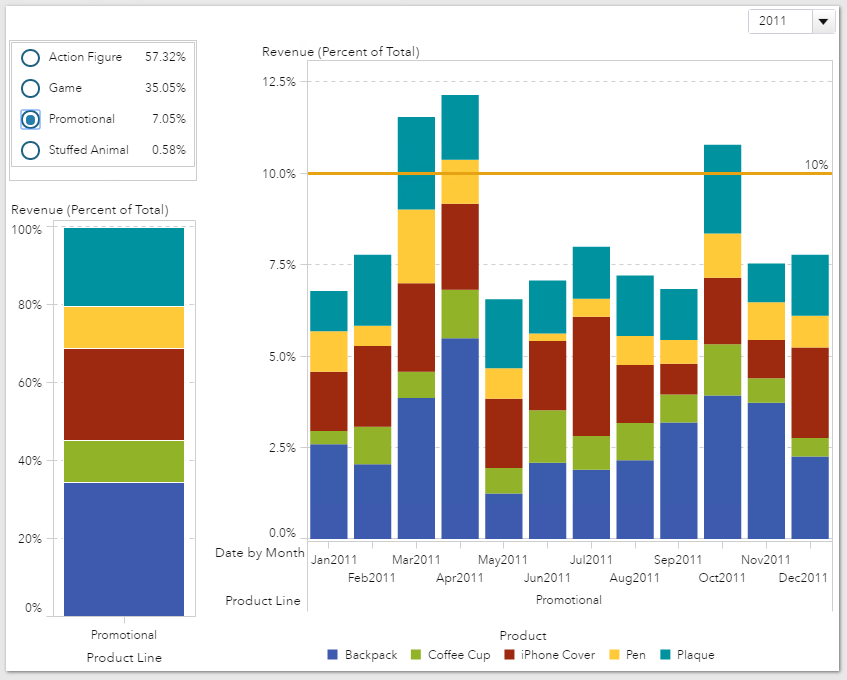
And in this view, for the Promotional Product Line which makes up 7.05% of the Frequency Percent of the data, we can see that there are a few Products that are outperforming the others. As these are promotional products this can be expected as trends and styles fluctuate.
After examining this report about Revenue (Percent of Total), you can easily think of other reports that would be useful to an organization. For the high and low Revenue (Percent of Total) values, are the number of employees assigned to the Products and/or Product Lines appropriate? What about the Expenses both Operational and Material for your most and least revenue generating Products and/or Product Lines, is the spending reasonable? Are the Product Material Costs justified?
Using a part-to-whole comparison visualization can help identify other areas of business that may need further investigation.
Example 2
Here is another report example using the Revenue (Percent of Total) metric with reference lines. In this example, we plotted Revenue (Percent of Total) against the months of the year. Here we can see how the Revenue (Percent of Total) is dispersed across the months. I’ve also added a 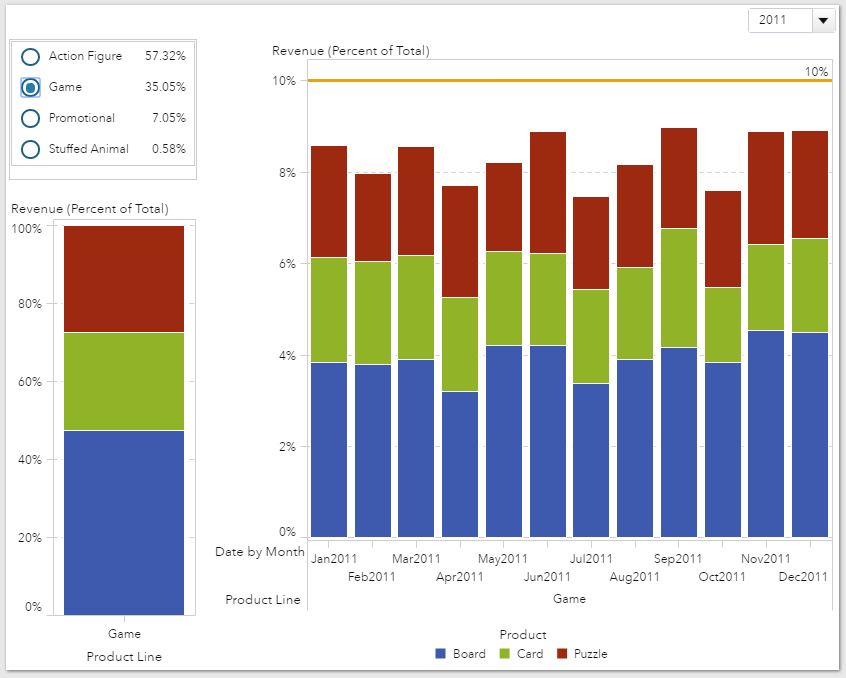
As the Promotional Product Line lends itself to the most fluctuation, we can see the breakdown of the Revenue (Percent of Total) and how it maps to the different months. Like the other report, this can then lead to additional reports to answer questions of if there is any seasonality to the spikes, or pair these findings with other market events. The Revenue (Percent of Total) for iPhone Covers is higher in July 2011, was there a new iPhone release that month? It may also be good to learn what was happening in April 2011 as the Revenue (Percent of Total) for Backpacks increased.
Combining the results of these reports with other groups in the organization can help determine which business decisions are having the desired impact on the bottom line results. Are the marketing strategies effective? Are the planned expense reductions are being met? Are we making better use of our product material waste?
Reference lines can help by making it easy to quickly identify whether or not targets are being met. And by using the Revenue (Percent of Total), a single reference line can be used across several categories since the scale has been adjusted to 100%.
