 A coworker was recently in need of some simple graphics to include in a slide show to accompany her SAS Global Forum paper. After listening to what she wanted, I decided that I could use PROC SGPLOT to create those images for her.
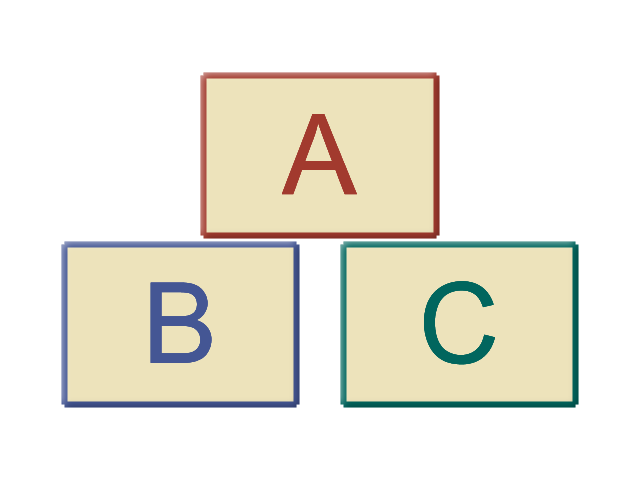
The first image was a set of stacked blocks displaying the letters A, B, and C. Since blocks are drawn with only four coordinates, we can draw those using the POLYGON statement. We can use the MARKERCHAR option in the SCATTER statement to draw letters within each block.
The POLYGON statement was added to PROC SGPLOT in the first maintenance release of SAS 9.4 (TS1M1) and enables you to define the X and Y coordinates to draw a polygon. The ID required argument in the POLYGON statement identifies each set of X, Y coordinates for a particular polygon.
In a DATA step, we defined the coordinates for each of the blocks, the center of the block, and the letter to use for the marker character:
data blocks; input x y letter $ xcen ycen; datalines; 10 10 B 15 15 10 20 B 15 15 20 20 B 15 15 20 10 B 15 15 16 20.5 A 21 25.5 26 20.5 A 21 25.5 26 30.5 A 21 25.5 16 30.5 A 21 25.5 22 10 C 27 15 32 10 C 27 15 32 20 C 27 15 22 20 C 27 15 ; run; |
In PROC SGPLOT, we defined the POLYGON statement before the SCATTER statement so that the letters are drawn on top of the filled blocks.
proc sgplot data=blocks noautolegend noborder; polygon x=x y=y id=letter / outline lineattrs=(thickness=6px ) fill dataskin=matte FILLATTRS=(color=cxEDE3BB) group=letter; scatter x=xcen y=ycen / markerchar=letter markercharattrs=(size=80) group=letter; yaxis display=none; xaxis display=none; run; |
 You can build on this code to add tops and sides to create a three-dimensional look for your blocks.
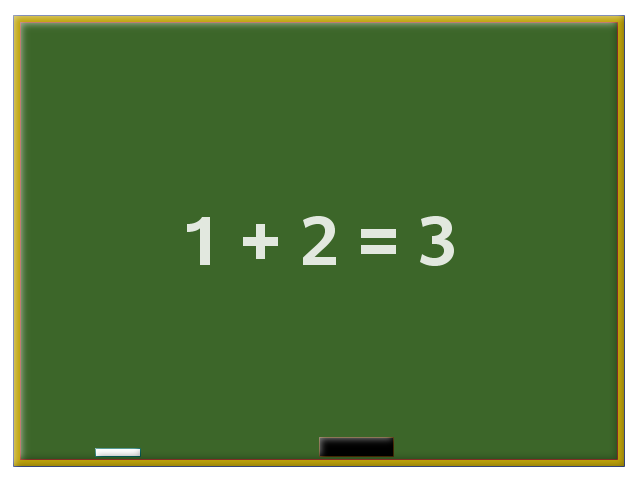
An image of an old fashioned chalkboard with writing on it was also needed. Similar to the blocks, the chalkboard can be drawn using the POLYGON statement with coordinates for the board and a frame. We can even define coordinates to draw a piece of chalk and an eraser.
data board; input x y part $; datalines; 9.5 9.5 frame 9.5 40.5 frame 50.5 40.5 frame 50.5 9.5 frame 10 10 board 10 40 board 50 40 board 50 10 board 15 10.2 chalk 15 10.75 chalk 18 10.75 chalk 18 10.2 chalk 30 10.2 eraser 30 11.5 eraser 35 11.5 eraser 35 10.2 eraser ; run; |
To add the writing on the chalkboard, we can define an SG annotation data set and reference it in the PROC SGPLOT statement using the SGANNO option.
In a DATA step, specify the TEXT annotate function and use the X1 and Y1 annotate variables to define the location of the text. The DRAWSPACE variable specifies that the X1 and Y1 variables are in relation to the percentage of the wall space, placing the text in the center of the chalkboard. Other variables can be added to modify the text attributes.
data sganno; function='text'; x1=50; y1=50; drawspace='wallpercent'; label='1 + 2 = 3'; textcolor='white'; width=100; anchor='center'; textweight='bold'; textfont='Albany AMT'; textsize=50; transparency=0.15; run; |
To define the colors for each piece of the chalkboard, we can define an attribute map and reference it in the PROC SGPLOT statement using the DATTRMAP option and in the POLYGON statement using the ATTRID option.
In a DATA step, define the ID required variable to contain the name of the attribute map. The VALUE required variable contains the value of the item to be changed, which in this case is the polygon ID value. The FILLCOLOR variable contains the name of the color to be used for each polygon.
data attrmap; id='board'; input value $ fillcolor $; datalines; frame cxBFA40B board delg chalk white eraser black ; run; |
Adding the annotation and attribute map to the PROC SGPLOT step, we create the chalkboard.
proc sgplot data=board sganno=sganno dattrmap=attrmap noautolegend noborder nosubpixel; polygon x=x y=y id=id / group=id fill outline dataskin=matte attrid=board; xaxis display=none; yaxis display=none; run; |
 Finally, we created a school house. Using the techniques we have used so far, we can define all the parts of a school house to draw the building, door, windows, and add the word “school.”
data school; input x y part $; x1=44.25; y1=20; datalines; 40 10 building 40 60 building 45 75 building 50 60 building 50 10 building 44 10 door 44 35 door 46 35 door 46 10 door 45 75 roof 40 60 roof 39 59 roof 45 78 roof 51 59 roof 50 60 roof 41 30 windowl 41 50 windowl 43 50 windowl 43 30 windowl 47 30 windowr 47 50 windowr 49 50 windowr 49 30 windowr ; run; data attrmap; id='school'; input value $ fillcolor $; datalines; building cxF52707 door cxc4a854 roof black windowl white windowr white ; run; data panes; drawspace='datavalue'; function='line'; linecolor='black'; linethickness=5; x1=41; y1=40; x2=43; y2=40; output; x1=42; y1=50; x2=42; y2=30; output; x1=47; y1=40; x2=49; y2=40; output; x1=48; y1=50; x2=48; y2=30; output; function='text'; width=25; x1=45; y1=38; label='SCHOOL'; textcolor='black'; textsize=20; textweight='bold'; output; run; proc sgplot data=school dattrmap=attrmap sganno=panes noborder noautolegend; polygon x=x y=y id=part / outline lineattrs=(thickness=4px color=black ) fill dataskin=matte group=part attrid=school; scatter x=x1 y=y1 / markerattrs=(color=black symbol=circlefilled); xaxis display=none; yaxis display=none; run; |

Think of all the great images you could create with PROC SGPLOT and a little imagination!

4 Comments
polygon x=x y=y id=id / group=id fill outline dataskin=matte
Should be:
polygon x=x y=y id=Part / group=Part fill outline dataskin=matte
Notice the replacement of id with Part... 😉
I meant to make not that this was for the Chalkboard illustration...
If I could edit my submission, I would fix my replies. The second reply should be "note" not "not."
Rex,
You're correct. The ID= and GROUP= should reference PART rather than ID in the chalkboard sample.
polygon x=x y=y id=PART/ group=PART fill outline dataskin=matte
attrid=board;
Thanks for pointing that out.