 In Microsoft Excel, a PivotTable can help you to create an interactive view of summarized data. Within a PivotTable, it’s easy to adjust the dimensions (columns and rows) and calculated measures to suit your ad-hoc reporting needs. You can also create a PivotChart – similar in concept to a PivotTable, but using a visualization technique such as a bar chart instead of a table.
SAS provides a special ODS tagset that can add a PivotTable or a PivotChart to your Microsoft Excel workbook automatically. It’s called the TableEditor tagset, and you can download it for free from the SAS support site.
In the example in this post, we’ll use the ODS EXCEL destination to create a native Open Office XML file (XLSX file) for Excel to read. Then we’ll use the TableEditor tagset to update the workbook to add a PivotTable to this worksheet.
How to access the TableEditor tagset
You can automate PivotTable creation by using the downloadable TableEditor tagset on the Windows operating system. If your network allows you to access the Web from within your SAS session, you can even use %INCLUDE to access the tagset directly within your program:
/* reference the tagset from support.sas.com */
Filename tpl url
"http://support.sas.com/rnd/base/ods/odsmarkup/tableeditor/tableeditor.tpl";

/* insert the tagset into the search path for ODS templates */
Ods path(Prepend) work.templat(update);
%include tpl;
If you cannot use FILENAME URL, then simply download the TPL file to a local folder on your PC, and change the %INCLUDE statement to reference the file from that location.
Creating the Excel workbook
This latest version of the tagset allows you add a PivotTable to any data source that Excel can read, regardless of how that Excel file was created and without having to generate an intermediate HTML file. SAS allows you to create Excel content using several methods, including:
- ODS CSV (or simple DATA step) to create a comma-separated value representation of data as a source for an Excel worksheet
- ODS tagsets.ExcelXP, which creates an XML representation of a workbook that Excel can read.
- PROC EXPORT with DBMS=EXCEL, EXCELCS, or XLSX (requires SAS/ACCESS to PC Files)
- ODS EXCEL (new in SAS 9.4 and still labeled “experimental” as of SAS 9.4 Maintenance 2)
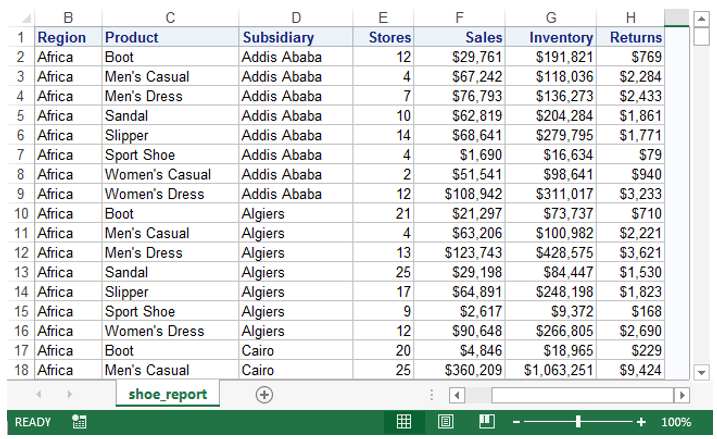
Here’s program to create the Excel content from the SHOES sample data. Change the “temp” file path as needed for your own system.
ods excel file="c:\temp\temp.xlsx" options(sheet_name="shoe_report");

proc print data=sashelp.shoes;
run;

ods excel close;
Here’s a sample of the output Excel workbook.
Working with TableEditor tagset options for PivotTables
The TableEditor tagset has options to control the various drop zones of an Excel PivotTable such as:
- Page area - uses one or more fields to subset or filter the data .
- Data area— a field that contains values to be summarized.
- Column area—a field to assign to a column orientation in the PivotTable.
- Row area—a field that you assign to a row orientation which is used to categorize the data.
The options to control these drop zones in the PivotTable are the PIVOTPAGE=, PIVOTROW=, PIVOTCOL= and PIVOTDATA= options. Each of these options can specify a single column or multiple columns (each separated with a comma).
The UPDATE_TARGET= option contains the name of the workbook to update, while the SHEET_NAME= option which specifies which sheet should be used as the source for the PivotTable. The OUTPUT_TYPE= option is set to “Script”, which tells the tagset to create a JavaScript output file with the Excel commands. Other options can control formatting, appearance, and the summarizations of the PivotTable.
NOTE: when specifying a file path in the UPDATE_TARGET= option, you must “escape” each backslash by using an additional backslash. The backslash character has a special meaning in JavaScript that turns special characters into string characters.
Here are some notes on the remaining options:
- PIVOT_SHEET_NAME= (new option) allows you to name the PivotTable to be named different from the source worksheet name. (The default is to append “_Pivot” to the source worksheet name.)
- PIVOT_TITLE= (new option) adds a title to the PivotTable.
- PIVOTDATA_FMT= specifies the numeric display format
- PIVOT_FORMAT= specifies one of the Excel table formats (found on the formatting style ribbon).
Creating the PivotTable
We’ll use a two-step technique to add a PivotTable to our sample workbook:
- Use ODS tagsets.TableEditor and special PIVOT options to create a script file that contains instructions for the PivotTable that we want.
- Use the X command to execute that script file, which will automate Microsoft Excel to add the PivotTable content.
Here’s a program that generates the script and executes it. The NOXSYNC and NOXWAIT options allow control to return to the SAS session as the script is run.
options noxsync noxwait;
ods tagsets.tableeditor file="c:\temp\PivotTable.js"
/* remember to escape the backslashes */
  options(update_target="c:\\temp\\temp.xlsx" doc="help"
    output_type="script"
    sheet_name="shoe_report"
    pivot_sheet_name="Profit Analysis"
    pivotrow="region"
    pivotcol="product"
    pivotdata="sales"
    pivotdata_fmt="$#,###"
    pivot_format="light1"
    pivot_title="Pivot Analysis for XXX"
);

/* dummy output to trigger the file creation */
data _null_;
 file print;
 put "test";
run;

ods tagsets.tableeditor close;
x "c:\temp\PivotTable.js";
Here is a sample of the PivotTable output.

Creating PivotCharts
What’s a good PivotTable without a PivotChart? PivotCharts can be added to an existing workbook as well. Simply add the PIVOTCHARTS=”yes” option along with the CHART_TYPE option.
options noxsync noxwait;
ods tagsets.tableeditor file="c:\temp\PivotChart.js"
  /* remember to escape the backslashes */
  options(update_target="c:\\temp\\temp.xlsx"
    output_type="script"
    sheet_name="shoe_report"
    pivot_sheet_name="Profit Analysis Chart"
    pivotrow="region"
    pivotcol="product"
    pivotdata="sales"
    pivotdata_fmt="$#,###"
    pivot_title="Pivot Analysis for XXX"
    pivot_format="light1"
    pivotcharts="yes"
    pivot_chart_name="Profit Analysis Charts"
    chart_type="columnclustered"
);

/* dummy output to trigger the file creation */
data _null_;
 file print;
 put "test";
run;

ods tagsets.tableeditor close;
x "c:\temp\PivotChart.js";
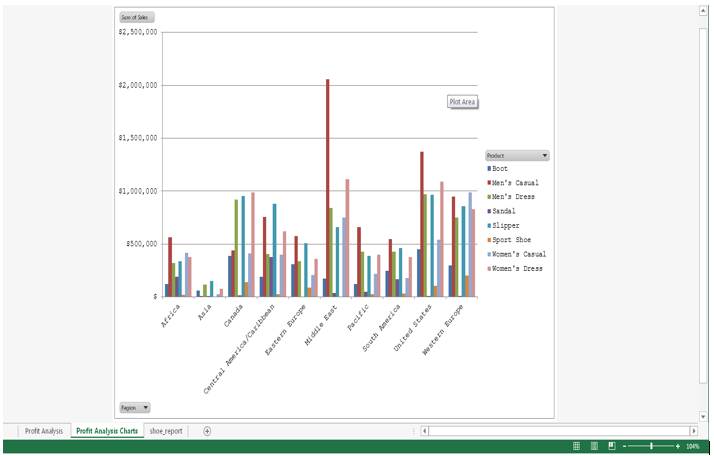
Here is a sample of the PivotChart output.
Getting more help
To see a full list of tagsets.TableEditor options within SAS, including a list of PivotChart types that you can use, specify the DOC=”help” option.
filename d temp;
ods tagsets.tableeditor file=d options( doc="help");
ods tagsets.tableeditor close;
The complete reference documentation will appear in the SAS log.
See also
Using SAS® Output Delivery System (ODS) Markup to Generate Custom PivotTable and PivotChart Reports

26 Comments
Hi Chevell,
My unix environment is compatible for excel files as I export of so many excel files to my unix path. I am using SAS EG 8.3 (64bit) on Grid (Unix environment). I am facing issues with tableeditor.tpl. I kept the file in my Unix path and call the code using %include "&path/tableeditor.tpl"; in the editor. Everytime I run, I am getting an error please see below
29 +
_
180
WARNING: Apparent symbolic reference AMP not resolved.
ERROR 180-322: Statement is not valid or it is used out of proper order.
11816 + Stratton
________
180
WARNING: Apparent symbolic reference AMP not resolved.
ERROR 180-322: Statement is not valid or it is used out of proper order.
Not sure how to correctly read this .tpl file. Can you please guide how can I run this successfully? I have to create pivot tables every day like 15 to 20 pivots in a day. I would like to automate it through SAS tableeditor.
Hi Chevell,
I am running SAS EG 8.3 (64bit) on SAS Grid (Unix environment). My unix environment is compatible for excel files as I export of so many excel files to my unix path. I am facing issues with tableeditor.tpl. I kept the file in my Unix path and call the code using %include "&path/tableeditor.tpl"; in the editor. Everytime I run, I am getting an error please see below
29 +
_
180
WARNING: Apparent symbolic reference AMP not resolved.
ERROR 180-322: Statement is not valid or it is used out of proper order.
11816 + Stratton
________
180
WARNING: Apparent symbolic reference AMP not resolved.
ERROR 180-322: Statement is not valid or it is used out of proper order.
Not sure how to correctly read this .tpl file. Can you please guide how can I run this successfully? I have to create pivot tables every day like 15 to 20 pivots in a day. I would like to automate it through SAS tableeditor.
Hi Chevell,
is there a way to set the pivot table source to a table instead of a sheet?
i want to later update the source sheet with proc export and if the pivot table dont have a table as a source the changes to the source are hard to update if i dont want to rebuild the whole workbook.
thanks!
Hello Lars,
Thanks for the update and reporting the issue that you found. I believe that this might have been introduced with the last update. If you create a tracking entry with Technical Support or send me email, I will send you a version of the tagset which includes the fix for this issue until I have a new copy posted. Your other question was if you could set the pivot table source to a table instead of the sheet. You can specify a range, but not the actual table currently. I can see where this could be beneficial and will add this capability.
Sincerely,
Chevell
Hello Lars,
I stand corrected on part of my last communication as the tagset is working as expected. You specified the Pivot_Slicer="Region" however the region column did not get defined anywhere for the columns that are used for the column used to generate the pivot table. As you mentioned, you could specify the options PivotPage="Region" and then use the Pivot_Slicer="Region" and this should work.
Thanks,
Chevell
Hi again Chevell,
i would also say that the following option also would be required to make a realistic userfriendly output:
pvtTable.PivotFields("SUM OF XXXX").Caption="Here comes the caption of the field";
regards lars
Hello Lars,
You can use the PiVOTDATA_CAPTION= option to label the analysis field rather taking the default which is what you are seieng.
Sincerely,
Chevell
Hi Chevell,
a great tagset and works well with the basics.
I have a problem when adding the slicer option as the js scripts are missing an object on execution afterwards.
i tried to compare that with the microsoft docs for slicer object. is there maybe an error in the translation to the js code?
here the details:
options noxsync noxwait;
ods tagsets.tableeditor file="&out_dir.\PivotTable.js"
/* remember to escape the backslashes */
options(update_target="&out_dir_js.\\temp.xlsx" doc="help"
output_type="script"
sheet_name="shoe_report"
pivot_sheet_name="Profit Analysis"
pivot_slicer="region"
pivot_slicer_position="200,10,100,100"
pivotrow="subsidiary"
pivotcol="product"
pivotdata="sales"
pivotdata_fmt="$#,###"
pivot_format="light1"
pivot_title="Pivot Analysis for XXX"
excel_save_file="&out_dir_js.\\tempPivot.xlsx"
);
/* dummy output to trigger the file creation */
data _null_;
file print;
put "test";
run;
ods tagsets.tableeditor close;
HERE WHAT THE JS SAYS REGARDING THE SLICER:
var SlC = wb.SlicerCaches;
var region=SlC.Add2(pws.PivotTables(1),"REGION");
var temp_region=region.Slicers.Add(SlicerDestination="Profit Analysis");
HERE MICROSOFT DOC:
//.SlicerCaches.Add("AdventureWorks", _
//"[Customer].[Customer Geography]").Slicers.Add SlicerDestination:="Sheet2", _
//Level:="[Customer].[Customer Geography].[Country]", Caption:="Country"
Thanks in advance!
i actually just found out that you can use the pivotpage="region" tag instead...
Hi Chevell, I was able to execute the pivot table code and noted that when I tried to change the location of the java script from temp to another directory I got an error. However when I changed it back to temp it worked. (hope this is helpful to others having issues.) The piece of code that doesn't seem to be working is the pivot chart. When I run that code I get the pivot table. Any thoughts?
Hello Tim,
You mentioned getting an error when writing to the temp directory. Do you have write access to this directory? If not, you are correct this will generate an error. I should have written this example to write to the WORK location instead. You also mentioned that the example does not produce a chart. If you have specified the option PIVOTCHART= which request the chart, are you getting any errors or dialog/scripting errors of any sort?
Sincerely,
Chevell
Right at the beginning (when running the proc print data=...), it gives me the error:
ERROR: Unable to load module 'SpreadsheetML' from template store!
ERROR: No body file. EXCEL output will not be created.
By the way, I am using SAS EG 5.1.
Hello Polina,
Make sure that the version of SAS is at least SAS 9.4M1 where ODS Excel is pre-production or even better SAS 9.4M3 where the
ODS Excel destination is production. I see this error quite frequently when the version of SAS predates ODS Excel.
Sincerely,
Chevell
I can run the X command to execute Visual Basic on SAS 9.4 TS Level 1M2 W32_7PRO platform. (I have to use X "WScript //NoLogo //B :\WINDOWS\Temp\ScriptName..vbs";)
But when I tried the javascript file with X "C:\Windows\Temp\PivotTable.js" and X "WScript //NoLogo //B C:\WINDOWS\Temp\PivotTable.js" and I get the same result each time. I get a Results Viewer tab in the SAS Display Manager that says "This page can't be displayed" *Make sure the web address is correct. *Look for the page with your search engine. * Refresh the page in a few minutes.
Could this is a Windows problem? I tried running the PivotTable.js straight in the Windows command box and it did nothing.
Make sure that you escape any of the slashes in the path specified using the UPDATE_TARGET= option which is used to specify the Excel workbook to open and add the pivot tables to.
The .js doesn't work for me. The only thing that's created in the Excel file is the title of the pivot table on a separate sheet with the sheet name. I get a runtime error when I try to run the .js file locally. Thoughts on what I'm doing wrong? Thank you.
Can always count on Chevell for some awesome advice. I've been playing around with the various options and really like the simplicity of the javascript code. We are still stuck in ver 9.2, so I do not have ver 9.4 and the capability of the new Excel tagset. So, I just used my old standby ODS TAGSETS.EXCELXP, saving the .XML as XLSX and then running the remaining code.
Hope to see you at SCSUG this year Chevell. Please come and give us one of your presentations.
It appears this only works if SAS is running on Windows, I am running SAS EG 6.1 on SAS Grid (Linux environment)... is there any way for pivots to work in that environment? A lot of people run in a unix environment, if this only works in a windows environment the that should be stated right up front.
Thanks,
I am running SAS 9.3 Window Env. I am wondering how to this get PivotTable.js. Thanks,
Is there a way to do something similar to this on a Unix environment where Excel would not be installed?
This method will not work on UNIX as it uses Office Objects and Excel is required.
Thanks for the excellent introduction, Chevell.
For even more on this important topic, another resource is:
“The Armchair Quarterback: Writing SAS Code for the Perfect Pivot (Table, That Is)”
By Peter Fernwood and Louanna Kong
http://support.sas.com/resources/papers/proceedings12/146-2012.pdf
Thanks Chevell, I've been looking for this tutorial 😀
Great! I hope that this is helpful.
My X command just runs forever, canceling it doesn't go anywhere either. Any thoughts? Running EG5.1 through a citrix server.
Running an X command that automates Excel (as this script does) might be a problem when using SAS Enterprise Guide. I ran Chevell's examples with EG and local SAS on my desktop, no problem. But on a remote server, the X command needs to spawn an Excel process that displays a window, and that probably won't work when dealing with a "headless" remote server.
As a workaround, you could download the JS file that the program creates, and then run it locally against the XLSX file. You could use a combination of the Copy Files task and Command Prompt task to automate that bit within an EG process flow.