Does your week start on Sunday or Monday? Do you have a promotional product you would like to see at the top of your list? Do you have a particular order in which you like to view your regions?
Custom sorting is now possible with SAS Visual Analytics 7.1. The ability to specify a custom sort order is available for category data items only. This includes any calculated data items that are categories and custom categories.
There is a limit, however. You can only specify a custom sort order for up to 25 values. This restriction does not mean that your category data item has to have a cardinality of 25 or less. It means, for example, that if you have 100 unique values for a category data item, you would only be able to specify the sort order for 25 of those 100 values.
Let’s look at how to create a custom sort order in SAS Visual Analytics Designer:
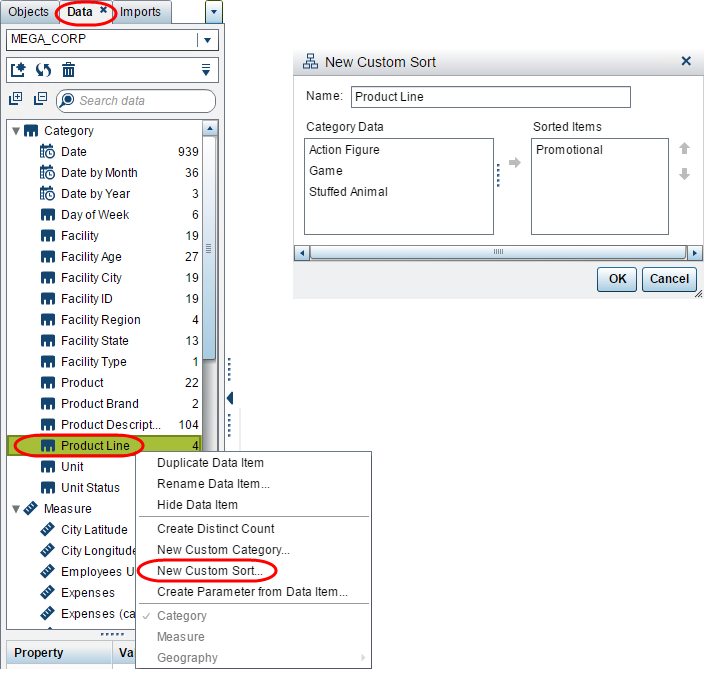
Selecting data values. Simply right-click on your category data item from the Data tab, and select New Custom Sort…. In the New Custom Sort dialogue, move the values over to the Sorted Items column in the order you want them sorted.
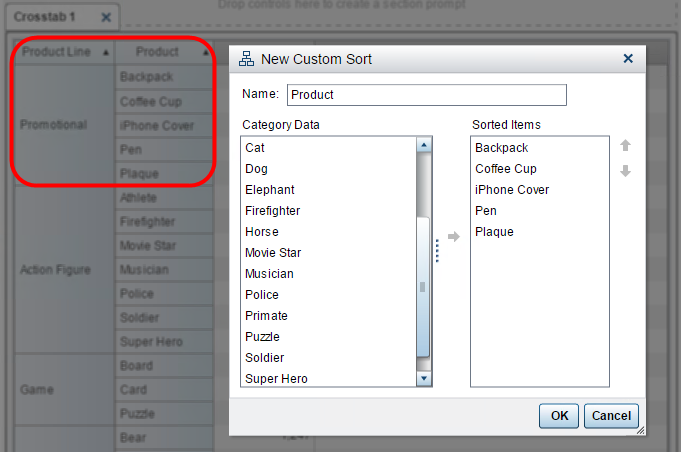
Handling larger numbers of values. You can do the same thing for a category data item with a larger number of values. In this example, I specify a sort order for the Product data item. You can see in the background I created a crosstab with Product Line then Product on the rows. I wanted to sort the Promotional Products to the top of the list, and I used the crosstab to help me quickly identify those values.
Notice for both examples that I only selected the values I wish to be sorted. The rest of the values will be sorted either ascending or descending depending on what is selected for your visualization.
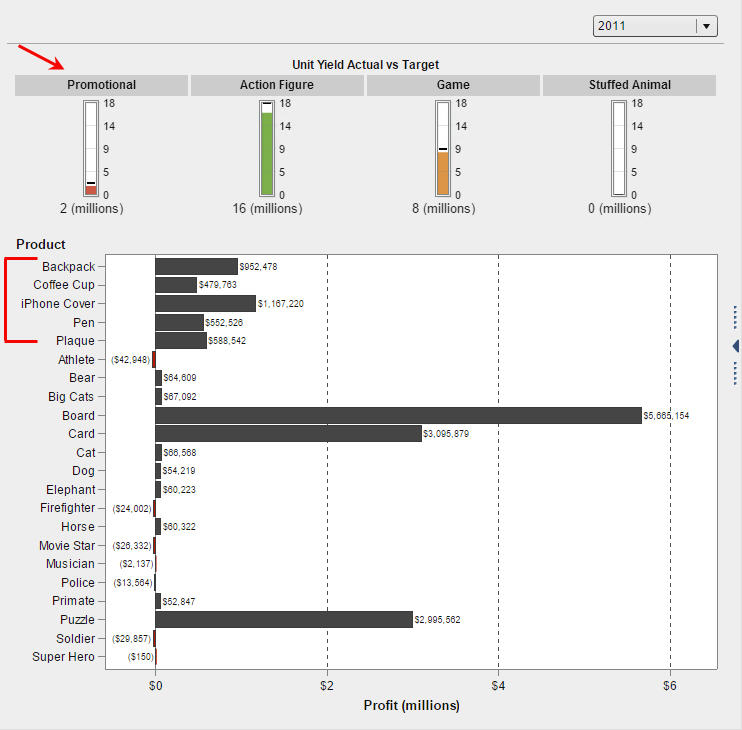
Producing final output. Here you can see in the final screenshot that the Promotional Product Line is the first gauge and that the Promotional Products are sorted to the top of the bar chart and then the rest of the values are sorted ascending.
I hope this new SAS Visual Analytics feature will help you fine-tune those report details.

7 Comments
Additional info: it is a category called "Day of Week", calculated from a date field.
Hi Barry,
Custom sorts are only available for category data items. Once you create your calculated data item for “day of week” be sure to use the Data pane and change the Classification property from measure to category. Now you can create the custom sort.
Thank you,
Teri
I tried applying a custom sort to a calculated item in SAS 8.3, but the option isn't even there when I right-click on the calculated item. Suggestions?
Hi Teri,
In 7.3, we are finding that when we apply a custom sort to a category and then display that in a bar chart (grouped) by year, the year sort gets disrupted in cases where there are missing values in the first item in our custom sort list in some of the years displayed. Are you aware of a work around for this?
Hi Jim,
Unfortunately, this is a known limitation of using custom sorts with the Group Role. It is documented and listed as the second bullet under the Using a Custom Sort section: For graphs, a custom sort does not work if the data item is assigned to one of the legend data roles (either Color or Group). The same restriction applies when sorting on the raw values of a data item that has a user-defined format.
Thank you,
Teri
New custom sort allows only around 20 to 25 items to be sorted.
How to sort when there are around 100 items
Did you ever figured out the answer?