 If you haven’t tried them for your web applications and other graphics needs, you’ll want to read further!
Scalable Vector Graphics (SVG) output is vector graphics output you can display with most (if not all) modern web browsers. Because SVG graphic output is scalable, you can zoom in on the graphics output without losing resolution. Unlike bit-mapped images such as PNG or GIF output, they can be resized or transformed without compromising the clarity, eliminating the need to produce multiple versions of the same image! There are other advantages for using Scalable Vector Graphics like their ability to zoom in to view details, their smaller output file size and their usefulness for producing graphics for a range of display sizes and types.
Which SAS products offer SVG graphics?
The SVG family of device drivers has shipped as part of the SAS/GRAPH product since the SAS 9.2 release. Note that you can only use these SVG device drivers with traditional SAS/GRAPH procedures such as PROC GPLOT and PROC GCHART.
Starting with SAS 9.3 version of the Base product, you can also create SVG output with the SAS SG procedures such as SGPLOT and SGPANEL as well as with graphics output created with ODS Graphics. In SAS 9.4, you can also use Scalable Vector Graphics to produce animations.
Typically, when you create SVG graphics, you will want to create the output in one of these ways:
- a standalone SVG file with a file extension of .svg
- an HTML output file using the ODS HTML statement
- an HTML5 output file in SAS 9.4
The output method you choose depends on your application. If you’re creating standalone SVG files, you can use that SVG file in some other document and make reference to it in another HTML page. For example, a common application for this would be creating logos in SVG that can be sized to any space. If you are using SAS 9.4, the HTML5 method is the best when creating an HTML document because the SVG can be embedded directly and there are no additional files to be moved.
In this blog post I’ll show you how to produce each one of these output types using the Base Product or SAS/GRAPH. I’ve also included a list of sample SAS/GRAPH animations that you can try.
Creating Scalable Vector Graphics with Base SAS
In SAS 9.3 and SAS 9.4, you can specify Scalable Vector Graphics output by specifying the OUTPUTFMT=SVG option on the ODS Graphics statement before the procedure step, such as:
ods graphics on / outputfmt=svg;
The examples in this sections use the sashelp.cars data set shipped with the SAS 9.3 and SAS 9.4 Base product to produce a bubble plot.
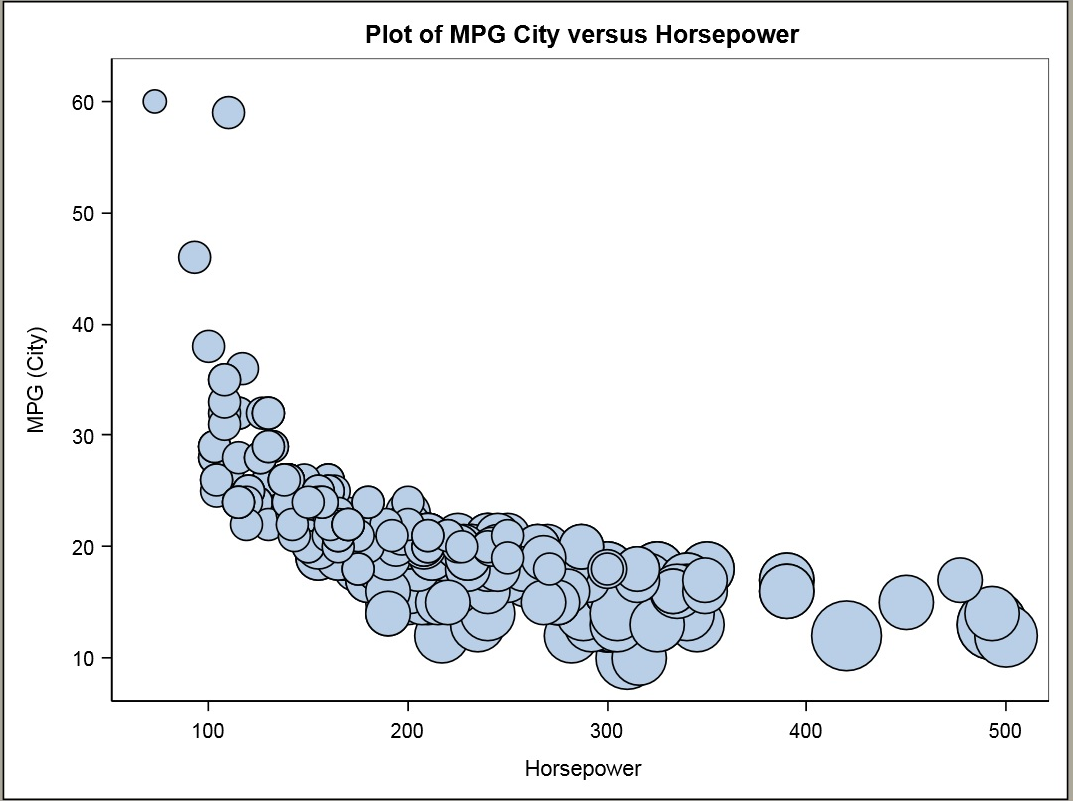
Stand-alone SVG file. The following sample code uses PROC SGPLOT to write a standalone SVG file with the name sastest.svg to the C:\temp directory when running on the Windows operating system:
    ods _all_ close;
    ods listing gpath='c:\temp';

    ods graphics / reset=all outputfmt=svg imagename='sastest';

    title1 'Plot of MPG City versus Horsepower';
    proc sgplot data=sashelp.cars;
      bubble x=horsepower y=mpg_city size=cylinders;
    run;
HTML file. This code uses the same PROC SGPLOT code to write a SVG file along with a corresponding HTML file to C:\temp when running on the Windows operating system:
    ods _all_ close;
    ods html path='c:\temp' (url=none) file='svg.html';

    ods graphics / outputfmt=svg;

    title1 'Plot of MPG City versus Horsepower';
    proc sgplot data=sashelp.cars;
      bubble x=horsepower y=mpg_city size=cylinders;
    run;

    ods html close;
    ods listing;
HTML 5 file. With SAS 9.4 only, you can use PROC SGPLOT with the ODS HTML5 statement to embed the SVG output in an HTML file. Note that with the code below, the SVG output is embedded inside the HTML output via the use of the svg_mode='inline' option on the ODS HTML5 statement.
    ods _all_ close;
    ods html5 path='c:\temp' (url=none) file='svg.html'
                options(svg_mode='inline');

    ods graphics / outputfmt=svg;

    title1 'Plot of MPG City versus Horsepower';
    proc sgplot data=sashelp.cars;
      bubble x=horsepower y=mpg_city size=cylinders;
    run;

    ods html5 close;
    ods listing;
Creating Scalable Vector Graphics with SAS/GRAPH
The examples in this sections use PROC GPLOT and the sashelp.class data set to produce a linear plot of weight versus height.
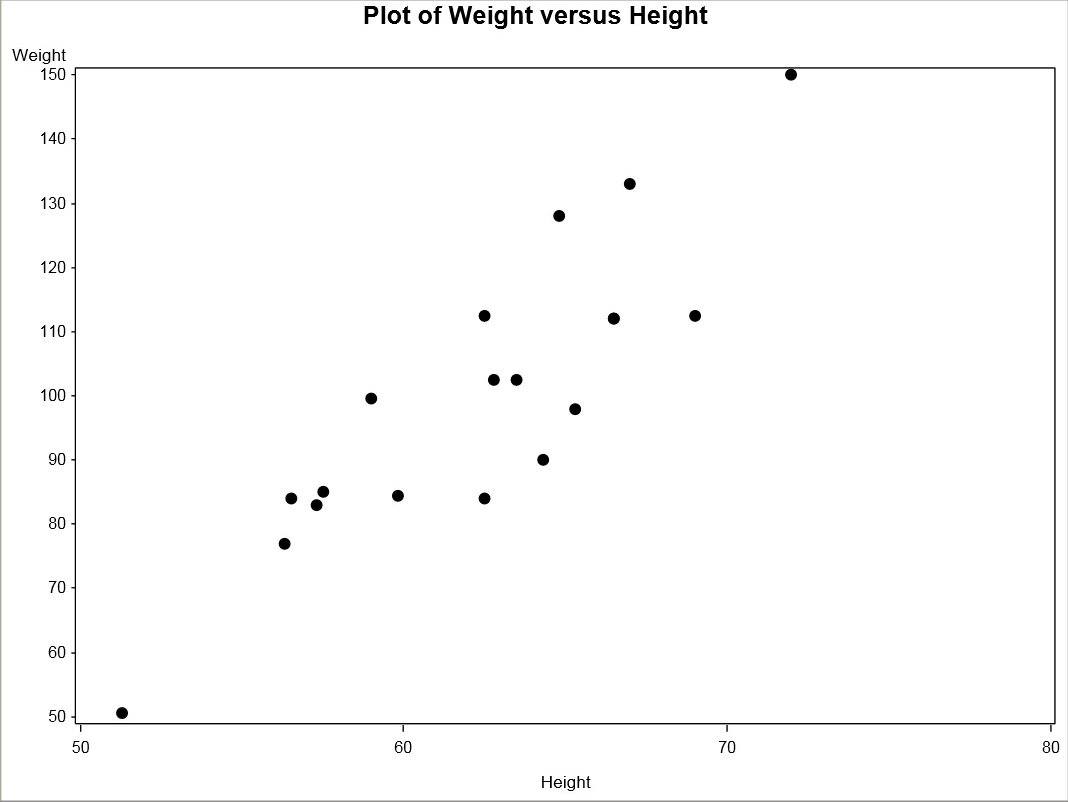
Stand-alone SVG file. Here is sample SAS code that uses PROC GPLOT to write a standalone SVG file with the name sastest.svg to the Temp directory on your C: drive when running on the Windows operating system:
    ods _all_ close;
    ods listing;

    filename grafout 'c:\temp\sastest.svg';

    goptions reset=all device=svg gsfname=grafout;

    symbol1 i=none v=dot c=black h=1.5;
    axis1 minor=none;
    title1 'Plot of Weight versus Height';
    proc gplot data=sashelp.class;
      plot weight*height / haxis=axis1 vaxis=axis1;
    run;
    quit;
HTML file. Here’s how to write the same output to a SVG file along with a corresponding HTML file:
    ods _all_ close;
    ods html path='c:\temp' (url=none) file='svg.html';

    goptions reset=all device=svg;

    symbol1 i=none v=dot c=black h=1.5;
    axis1 minor=none;
    title1 'Plot of Weight versus Height';
    proc gplot data=sashelp.class;
      plot weight*height / haxis=axis1 vaxis=axis1;
    run;
    quit;

    ods html close;
    ods listing;
HTML 5 file. With SAS 9.4 only, the following sample code uses PROC GPLOT together with the ODS HTML5 statement to embed the SVG output in the resulting HTML file. Note that with the code below, the SVG output is embedded inside the HTML output via the use of the svg_mode='inline' option on the ODS HTML5 statement.
    ods _all_ close;
    ods html5 path='c:\temp' (url=none) file='svg.html'
               options(svg_mode='inline');

    goptions reset=all device=svg;

    symbol1 i=none v=dot c=black h=1.5;
    axis1 minor=none;
    title1 'Plot of Weight versus Height';
    proc gplot data=sashelp.class;
      plot weight*height / haxis=axis1 vaxis=axis1;
    run;
    quit;

    ods html5 close;
    ods listing;
Using Scalable Vector Graphics for animation in SAS/GRAPH
Beginning with SAS 9.4, you can create animated graphs for the web using the SVG device driver together with new options available on the OPTIONS statement. Here are links to sample programs on support.sas.com that demonstrate how to create animated graphs for the web using the SAS 9.4 SVG device driver:
- Create animated SVG output using PROC GCHART
- Create animated SVG output that overlays a pie chart, a bar chart, and a scatter plot on the same page
- Create animated SVG output using PROC GPLOT
- Create animated SVG output using PROC GMAP
- Create animated SVG output using PROC GCHART
- Create animated SVG output using the GMAP, GCHART, GPLOT, and GREPLAY procedures
- Create animated SVG output using PROC GMAP and the Annotate facility

1 Comment
Thanks Martin. Great examples. I have a couple of questions:
In your Sample 49342, what does the options printerpath=svg statement do for you since you’ve already declared your device = svg ? I notice that you did not use this option in 49270 or 49270.
In looking through the SAS doc I see some discussion about device drivers vs ods printer or printerpath options, and I’m not sure I understand the difference; which is more versatile; or if there’s an advantage to that approach over the traditional device= syntax.
Also, when I use the SVGVIEW device, is there a way to turn off the tooltip, similar to the SVGnotip universal printer? I've not used the universal printer approach and I'm a little uncertain about what I might lose by trying that over the traditional device= method.