SAS Code for your Valentine - just in case you forgot to get flowers, chocolate or other tokens of affection for the big day yesterday.
proc format;
value x .5='e' 0='n' -.5='i' -1='M' other=' ';
value y -1='e' 0='B' other=' ';
run;
data h;
pi = constant("PI");
do r = 0 to pi by .02;
x = cos(r)*.5+.5;y1 = sin(r);y0 = 2.5*sin(r/2+pi);output;
x=-x;output;
end;
run;
proc sort ;by x;run;
proc sgplot data=h;
band x=x upper=y1 lower=y0/fillattrs=(color=CXFF0000);
format x x. y1 y0 y.;
xaxis valueattrs=(color=CXFF0000 weight=bold size=30 family="Brush Script MT");
yaxis valueattrs=(color=CXFF0000 weight=bold size=30 family="Brush Script MT");
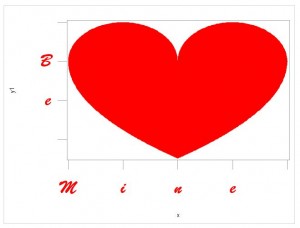
run;Here's what you will get:
Rick Wicklin uses SAS/IML Studio to provide a different parameterization. If my Valentine doesn't get you out of the dog house, read his post - A parametric view of love.

2 Comments
Hi
I am getting an error message when I try and run the code
ERROR: Procedure SGPlot not found
Any ideas?
Thanks Ange
Angie . . .
It sounds like you may not have the right SAS release installed for the SG procedures, a new family of graphics procedures built on top of the ODS GRAPHICS system. They were introduced in SAS 9.2 and required a SAS/GRAPH license. Starting with SAS 9.3 and forward, the SG procedures are part of BASE SAS.
-- Christina