Tag: sas visual analytics

Data Visualization | Learn SAS
Ryan Kumpfmiller 1
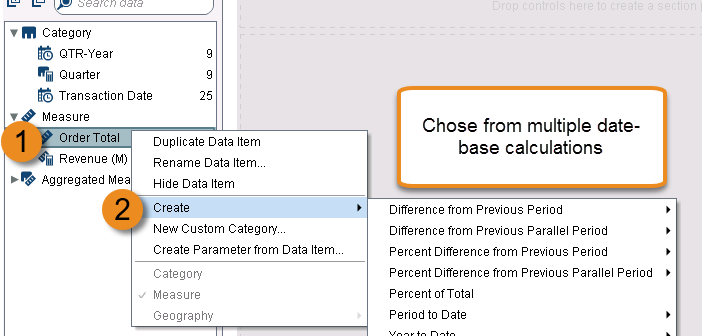
An introduction to SAS Visual Analytics: the Parallel Period function of the Derived Item calculations

My new SAS Press book “An Introduction to SAS Visual Analytics” (written in collaboration with Tricia Aanderud and Rob Collum) covers all of the different aspects of SAS® Visual Analytics, including how to develop reports, load data, and handle administration. Below is an example of the types of tips that you can find

Eric Rossland 6
Training options for SAS Visual Analytics

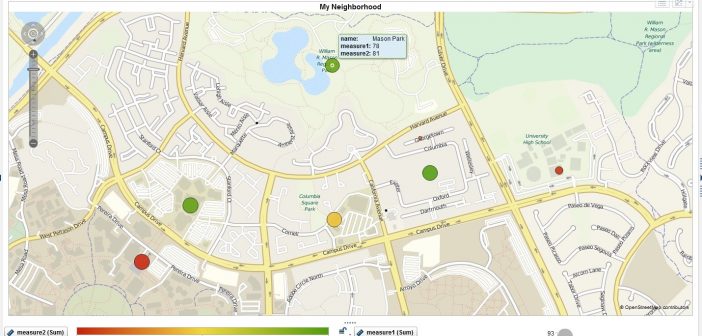
Have you seen SAS Visual Analytics yet? If not take a look at this site where you can try the software right from your browser. SAS Visual Analytics enables you to explore your data visually and then present your results, even to a mobile device. The best part – it’s

David Bass 1
Documentation for high-performance analytics

We are surrounded by massive quantities of data, and somewhere in there is the information that your organization needs. But being able to perform complex analysis on huge amounts of data isn’t enough – the analysis needs to take place quickly enough for you to be able to act on