Any of you who are even slightly into politics, or have followed any news lately, have probably seen something about the DNA test Elizabeth Warren took to prove/disprove her Native American ancestry. The test indicates she might have had a Native American ancestor 6 to 10 generations ago. That's a rather complex number to get your brain around, so I thought I'd create a visualization to help...
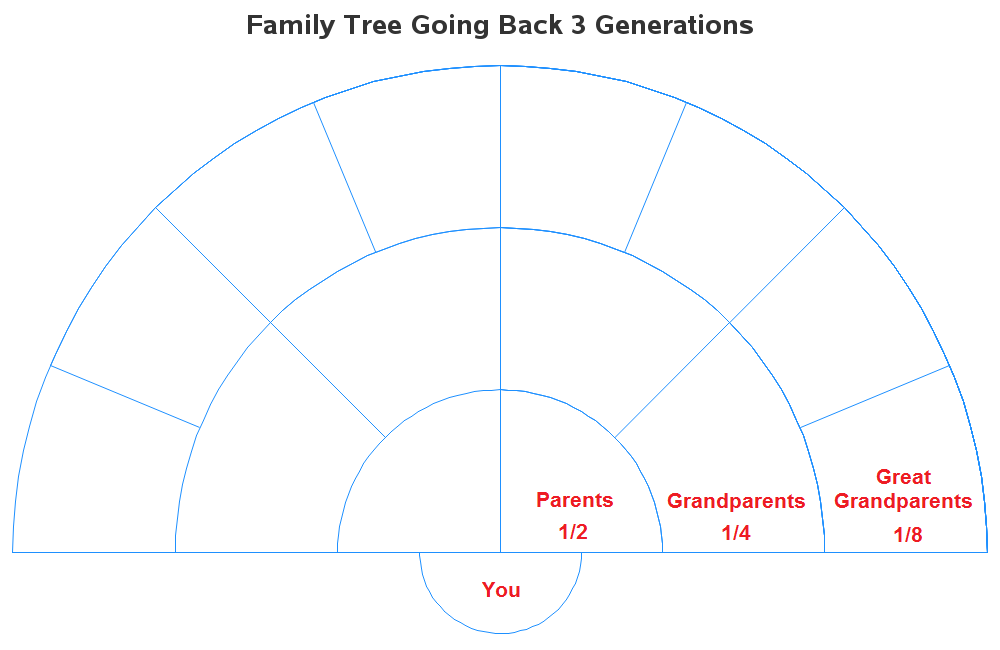
Let's start with a smaller example - a visualization going back 3 generations. You have two biological parents, four grandparents, and eight great grandparents ... and you got 1/2 of your DNA from each parent, ~1/4 from each grandparent, and ~1/8 from each great grandparent. Here's an article with more info on DNA numbers, if you want to dig a little deeper. Note that my chart shows 4 generations (when you include yourself), but it "goes back" 3 generations (from you) - I think this "counting fenceposts" problem is what confused some of the news organizations, and caused them to first print the wrong numbers, and then they had to go back and print corrections.
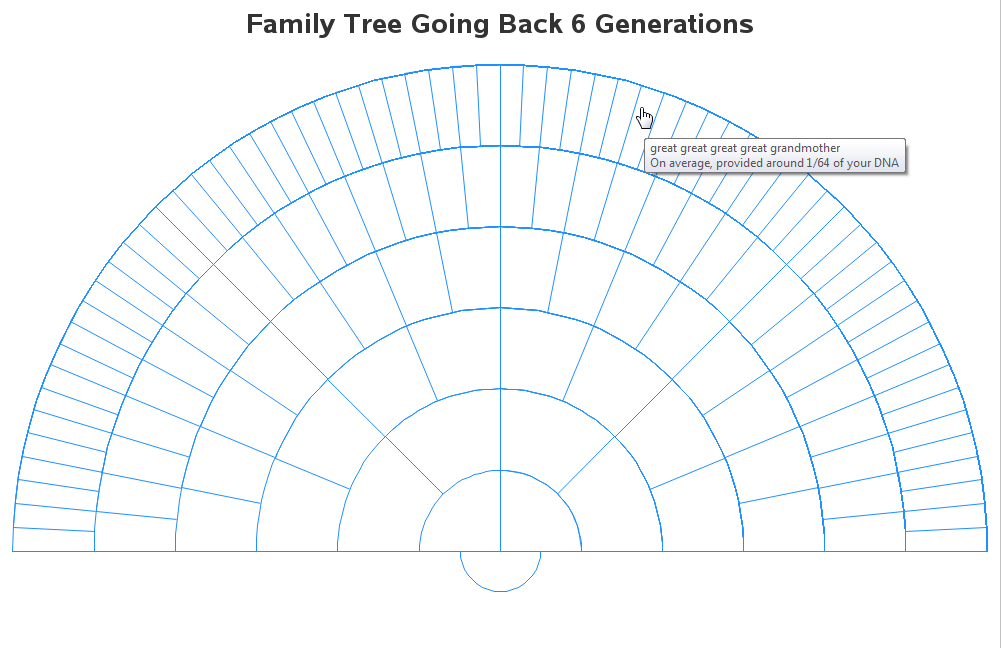
Now that you understand how I've laid out my graphic, let's visualize Elizabeth Warren's data. Her tests indicate that she might have had a Native American ancestor 6 to 10 generations ago, so let's start with a chart showing 6 generations. When you go back 6 generations, that's your great great great great grandparents, and there were 64 of them ... therefore you get approximately 1/64 of your DNA from each of them. In the previous example (above), I added some red text labels ... but with higher numbers of generations the graph quickly becomes too crowded for labels, therefore I added HTML mouse-over text. You can click this link to view the interactive version of the chart, with the mouse-over text for each pie slice.
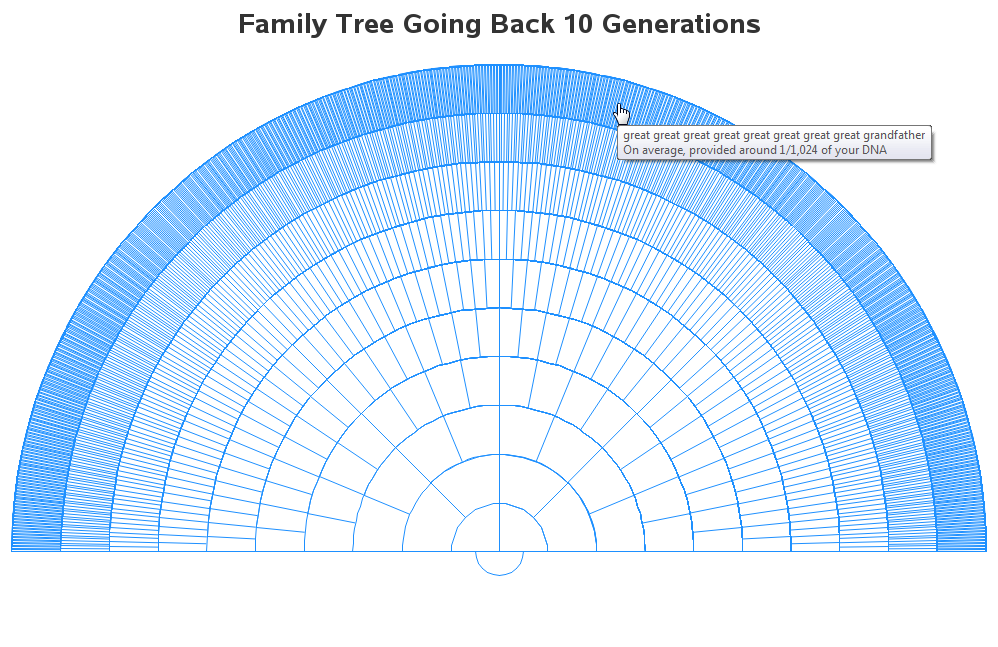
Now, let's go back 10 generations. Here, the outer ring represents your 1024 great great great great great great great great grandparents, and each of them contributed approximately 1/1024 of your DNA.
How'd he do that?...
This is all just simple overlaid pie slices, using the annotate pie function in SAS/Graph. I annotate them one ring at a time, starting with the outer slices. And then each successive smaller ring obscures the lines from the outer ring. As I am drawing the rings, I programmatically assign it as 'mother' or 'father' based on whether it's an odd/even numbered slice.
Hopefully this visualization helps you get a grasp on the numbers that have been floating around recently in the news, and also shows a cool example of the custom graphs you can create in SAS - here's a link to the code if you'd like to experiment with it.

9 Comments
Isn’t it the case that this assumes a consistent halving of the chromosomes, such that one passes on half of the chromosomes one received from both parents. Unlikely though it may be, a daughter who gets two X chromosomes from both parents, and 22 others from each parent, could, when she has her own child, pass on only the ones she got from her mother. While this is exceedingly unlikely, is it not the case that over ten or more generations, one might be only nominally, not genetically, descended from a particular ancestor; one might, in certain instances, share no chromosomes with that ancestor. Only if one is looking at the Y chromosome can one be certain of any relationship over so many generations given the probable dilution of the other 45 that might happen because of so many permutations.
Forgive me for asking a stupid question.
How many generations is recommended for a DNA match?
In case if two person think they have common ancestor 10 generations back, but the DNA test can be done between them as the ancestors DNA is not available. The real distance between our todays people is 20 generation ???
I dont see this, please advise
how much dna do you share going 121 gens back
Great visualization!
Love it. How about adding some way to show how many ancestors any two people in a particular population likely share?
;-)
With the DNA databases getting bigger and bigger, we might soon be able to calculate that 'exactly' rather than just 'likely'!
Really neat visualization! I think the annotate pie function (and annotate functions in general) do not get enough attention.
Pie for everyone! :)