For those of you who don't have SAS/Graph's Proc GMap, I recently showed how to 'fake' a variety of maps using Proc SGplot polygons. So far I've written blogs on creating: pretty maps, gradient shaded choropleth maps, and maps with markers at zip codes. And now (by special request from Darrin Brown), I'll show you how to draw a path on a map!
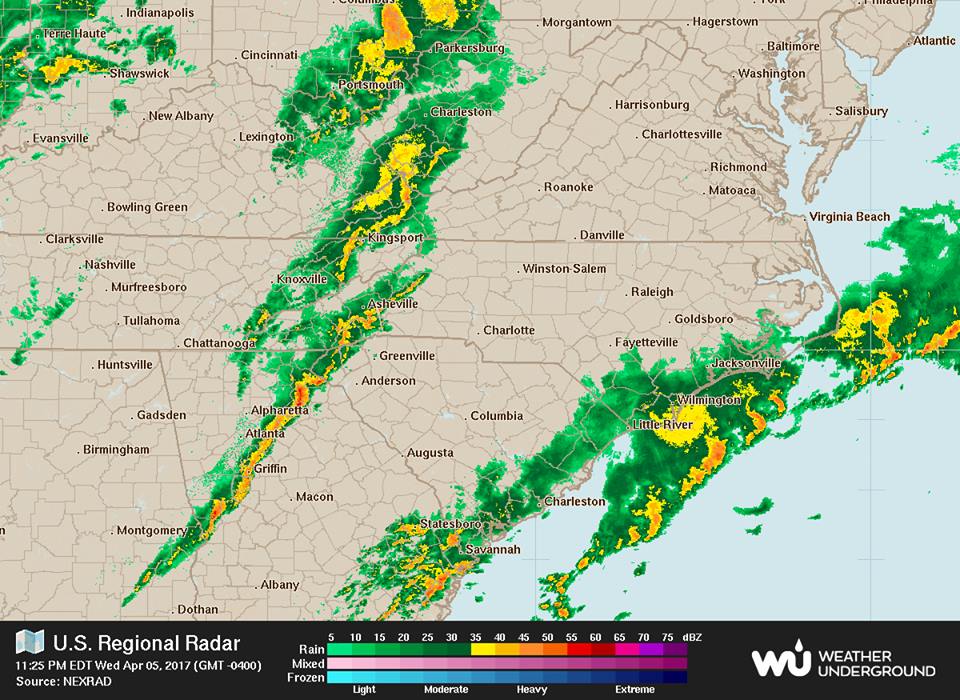
Let me set you up with the scenario for this map first ... the SAS Global Forum conference was over, and I was sitting on the plane in Orlando, FL getting ready to head back to Raleigh, NC - and they said we were going to have to wait because of bad weather in Raleigh. My seat-buddy checked the Raleigh weather on his smartphone, and there were severe thunderstorms, 50mph wind gusts, the possibility of tornadoes, etc. And the storm front was hundreds of miles long. So we waited. And waited. ... And waited some more. After a few hours, the captain was able to calculate a circuitous route that would let him slip in between the storm fronts and got it approved by the air traffic controllers, and we set out for our bumpy/lightning-filled ride back home.

It was dark by the time we took off, so I couldn't see many landmarks & coastlines, but I was able to get a rough estimate of the route we took using a compass. And when I got home, I grabbed a screen-capture of the storm fronts showing the corridor between them, and it matched up pretty well with my estimated path:
This morning at work, I was trying to pick a nice simple set of data to demonstrate plotting a path on a map using Proc SGplot, and I thought this might be interesting data. So I estimated a few lat/long points along the path I think our plane took, and created the following example:
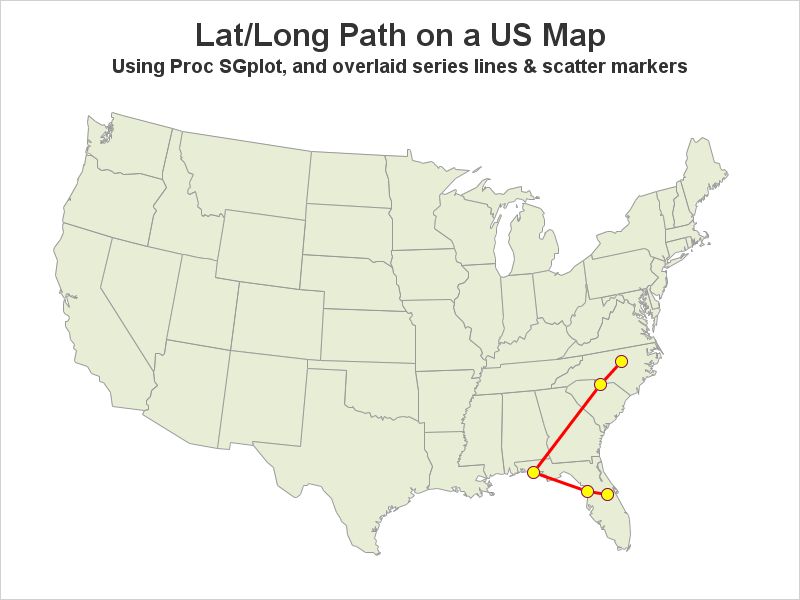
Note that the only real difference in this and my previous example showing how to plot markers at zip code locations, is that I'm specifying the lat/long values directly (instead of looking them up using Proc Geocode), and I added a series statement to the list of plots to overlay in my SGplot.
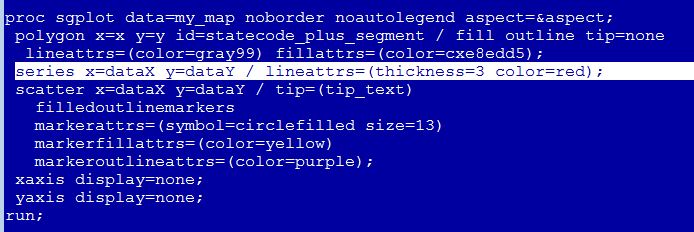
Here's a link to the complete code, if you'd like to download it and experiment (maybe try adding your own lat/long path). And if there are any other specific maps you'd like to be able to create using Proc SGplot, let me know!
Click here to see more examples about creating maps with Proc SGplot!
Dec 2017 Update: An official Proc SGmap is now available!


7 Comments
THANKS!!!
Very cool! Here is the official route:
http://flightaware.com/live/flight/SWA430/history/20170405/2135Z/KMCO/KRDU
Nice!
Hi. Nice (as always).
Idea (using a data step from the previous SGPLOT post) ... another way to geocode ZIPs given that SASHELP.ZIPCODE in indexed by ZIP. I added one bad ZIP (99999) to show how to handle ZIPs not found in SASHELP.ZIPCODE.
data locations;
retain anno_flag 1;
input zip @@;
set sashelp.zipcode (keep=zip x y rename=(x=long y=lat)) key=zip / unique;
if _error_ then do; _error_ = 0; delete; end;
city = zipcity(zip);
datalines;
3901 20601 1001 99999 27513
;
Nice!
PS. I had a similar trip home out of Orlando, then missed my connection in Ohio :( The whole plane was locked down in seat belts and my seatmate got airsick :( then I missed my connection and spent the night on a cot in the airport... On the positive side, I got to take some awesome from the plane window photos above the clouds this morning over and into the storm systems when I finally flew home.
Thumbs up! Next request is sparkline annotation :)