Users frequently ask how to plot their data as markers on a map. There are several ways to do this using SAS software. If you're a Visual Analytics user, you can do it using a point-and-click interface. But if you're a coder, you might need a little help... In this example, I show the basics of coding it using both Proc GMap and Proc SGplot.
Zip code Coordinates
The first thing you'll need to do is determine a latitude/longitude coordinate for the locations where you want markers. One way to do this is to use Proc Geocode. Depending on how much detail you have about the spatial location of your markers, you can use Proc Geocode to estimate the lat/long at the city, zip code, or street-level. In this simple example, I'm using zip codes. Here's the basic SAS code:
data locations; input Zip; anno_flag=1; datalines; 3901 20601 1001 27513 ; run; proc geocode data=locations out=locations (rename=(x=long y=lat)) method=ZIP lookup=sashelp.zipcode; run; |
Preparing the Map
We ship several map datasets with SAS/Graph. Each line (row) of data describes 1 point along the border of an area in the map. The density of points along the borders is usually more than you need, and therefore you might want to use the density variable to exclude points above a certain density level. You might also want to exclude certain map areas. Once you have the desired subset of a map dataset, you can combine it with the zip code data, project it (using Proc Gproject), and then split the two datasets apart again. Here's the basic code:
data my_map; set mapsgfk.us_states (where=(statecode not in ('AK' 'HI') and density<=3) drop=resolution); run; data combined; set my_map locations; run; proc gproject data=combined out=combined latlong eastlong degrees; id statecode; run; data my_map locations; set combined; if anno_flag=1 then output locations; else output my_map; run; |
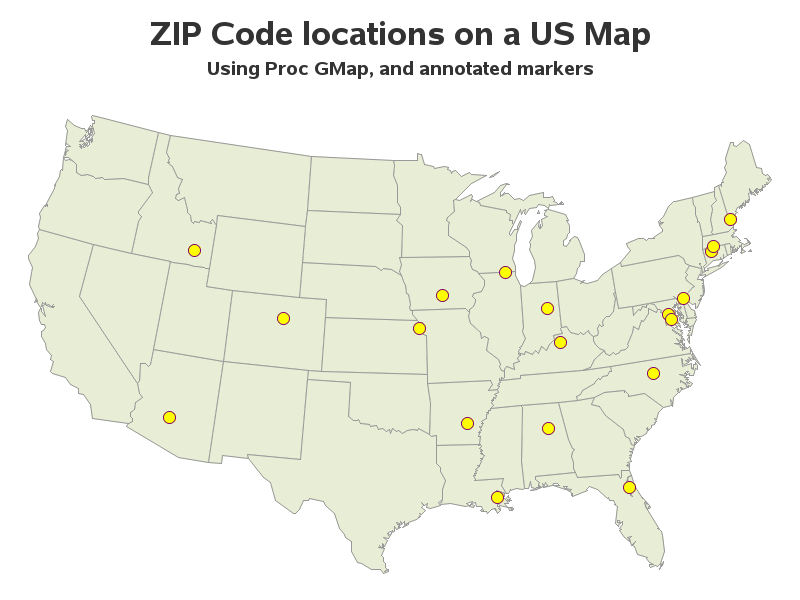
Proc GMap Version
SAS' traditional mapping software is Proc GMap (found in the SAS/Graph product). It was built for handling maps, and has many nice features included. To plot markers at the zip code locations, you first have to create an annotate dataset. For round markers, I like using the annotate pie function (alternatively, you can annotate characters from any font, or create custom markers). Here's the basic code for creating an annotate dataset:
data anno_locations; set locations; xsys='2'; ysys='2'; hsys='3'; when='a'; function='pie'; rotate=360; size=1.0; style='psolid'; color='yellow'; output; length html $300; html='title='||quote(trim(left(city))||'0d'x||trim(left(put(zip,z5.)))); style='pempty'; color='purple'; output; run; |
Once you've created the annotate dataset, you simply specify it using the anno= option when you create your Proc GMap:
proc gmap data=my_map map=my_map anno=anno_locations; id statecode; choro segment / levels=1 nolegend coutline=gray99; run; |
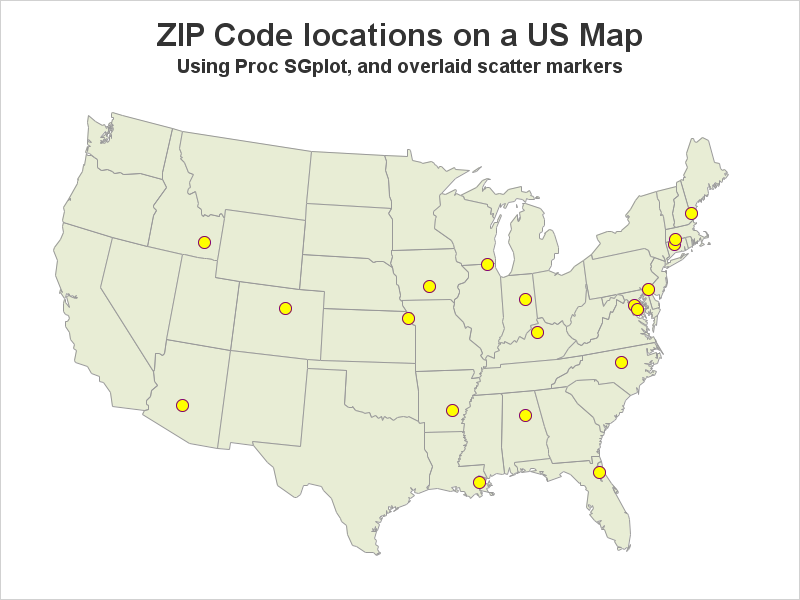
Proc SGplot Version
If you don't have the SAS/Graph product, you can also create maps with Proc SGplot (which is part of Base SAS), by using polygons, and overlay scatter plot markers at the zip code locations. You'll need to rename your markers' X & Y variables, so they're something different from the map's X & Y. And if you want the markers to have html mouse-over text, this is a good time to set that up.
data scatter_locations (rename=(x=zipX y=zipY)); set locations (keep = zip city x y); label city_zip='00'x; length city_zip $100; city_zip='= = = = ='||'0d'x||trim(left(city))||'0d'x||trim(left(zip)); run; |
You'll then need to combine the map and marker datasets, and specify both a polygon and scatter statement when you run Proc SGplot:
data my_map; set my_map scatter_locations; run; proc sgplot data=my_map noborder noautolegend; polygon x=x y=y id=statecode_plus_segment / fill outline tip=none lineattrs=(color=gray99) fillattrs=(color=cxe8edd5); scatter x=zipX y=zipY / tip=(city_zip) filledoutlinemarkers markerattrs=(symbol=circlefilled size=13) markerfillattrs=(color=yellow) markeroutlineattrs=(color=purple); xaxis display=none; yaxis display=none; run; |
As you might have guessed, I glossed over a few of the finer details in the above code. Here's a link to the complete code, if you'd like to see all the details, and experiment with plotting your own data. Note that you will need a SAS/Graph license to have access to the maps, Proc Geocode, and Proc Gproject. And you'll need a fairly recent version of SAS to be able to run Proc SGplot and generate the polygon map.
Click here to see more examples about creating maps with Proc SGplot!
Dec 2017 Update: An official Proc SGmap is now available!


10 Comments
I ran this on a fresh project (the culprit??):
proc print data=sashelp.vdest;run;
and got this:
1 TAGSETS.SASREPORT13(EGSR) Dove
Yikes! I had closed LISTING and HTML but not ALL. I'm not sure what else was "open" but "ALL" fixed it. The ODS business still befuddles me... Thanks so much.
SGPLOT maps are growing on me! I've been a long-time fan of GMAP and annotate but I really like the looks of the SGPLOT poly maps. How do I eliminate the index number "1" on the resulting png? I added reset to the "graphics on" statement and it prevents the png from indexing higher and higher with each run but I always get a "1" suffix.
For example, ods graphics on / reset imagename="My_file_name" height=6.25in width=8.33in imagefmt=staticmap imagemap=on tipmax=2500;
Result: My_file_name1.png
Thanks.
Hey Mike,
Do you, by any chance, have two ODS destinations open, such as ODS LISTING and ODS HTML? If so, one of them will get the filename without the index and the other will get the filename with the "1" index. Be sure to start your program with ODS _ALL_ CLOSE; to close any stray destinations. Hope this helps!
Thanks for these posts. I've learned a lot. Is it possible to connect the dots to show a path through the cities?
Keep an eye out - I'm planning to show that in a future blog post! :)
Sweet!
Wonderful plots. What modification would be need to add frequency counts to the plot for each zip code? Thanks
Consider this pseudo-code (since I haven't tested it), but it would only require a few extra commands right after the annotate code for the 'pie's. Something like this would annotate frequency above each dot marker ...
function='label'; style=''; rotate=.; position='2'; text=trim(left(frequency)); output;
Cool! Next up is to see if the symbolimage capability in PROC GPLOT will allow use with the POLYGON statement - then I will finally attain my goal of sparklines on SAS-generated maps!!! Too busy right now but it's on my radar - maybe at SGF!