After the recent presidential election, I was updating my graphs of the voter registration data and noticed that the number of registered voters decreased after the election. At first I thought that was odd, but then I realized that maybe inactive voters were being purged. I wanted to find out more about this, so I rolled up my sleeves and got elbow-deep into analyzing the data...
And to get you in the mood for this topic, here's my friend Trena who is an avid voter:

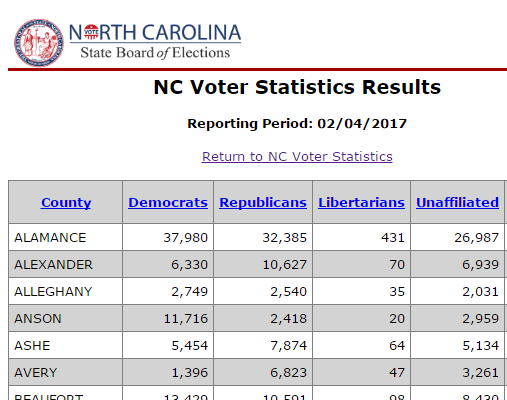
Here in North Carolina (NC), the Board of Elections has a website where they post the voter registration totals for each of the 100 counties. It's a snapshot in time, for the totals on that date. Here's a snapshot of a portion of one of their tables:
I had written a macro to import their data directly from the tables, and I had set it up to get a yearly snapshot of the data going back to 2004 (see my previous blog post on that). But now I wanted to see the data in a bit more detail - I needed monthly values. This is the tedious part ... their reports are named by date, and the dates aren't guaranteed consistent/predictable. Therefore I had to manually go to the earliest report from each month and look at the date, and then hard-code it into my SAS job to call the macro for each desired monthly snapshot (see code below, and imagine looking up the dates for 12 months x 10+ years). The good thing about the tedious parts like that is you only have to do them once - and I think it was definitely worth the work, to get the interesting graphs!

I live in Wake county, North Carolina, so I'll use Wake county data to demonstrate (I'll provide a link to the other 100 counties if you want to see their graphs also). Below is a graph of my monthly snapshot data - note that the earlier years didn't have monthly data available. I added the green numbers so you will know which portion of the graph I'm talking about.
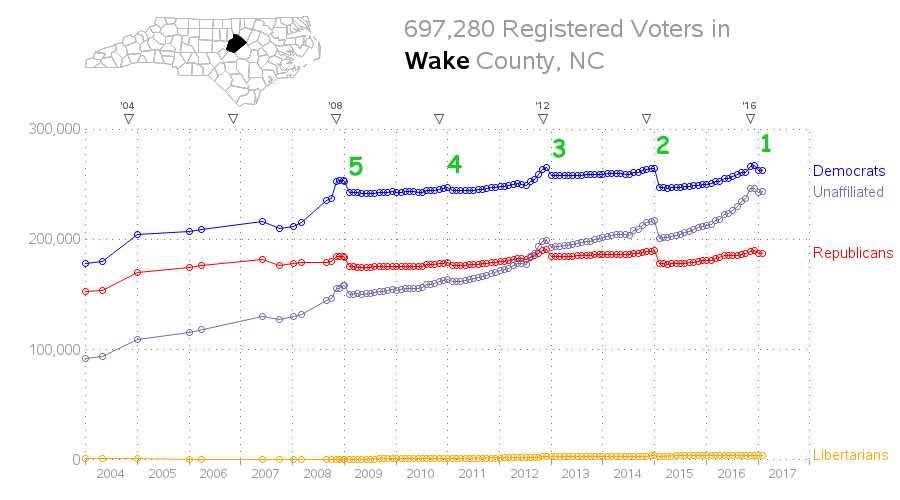
When I started adding the recent monthly values to the graph, I first noticed that there's a dip in the number of registered voters right after the 2016 election (#1). It surprised me initially, but then I remembered that I had heard your voter registration is purged if you don't vote for 4 elections (2 federal election cycles + 2 more federal election cycles). Just to be sure, I looked up the official policy in the ncsbe website FAQ:
"Voters are removed from the voter rolls due to a biennial list maintenance process that is mandated by federal and state law. If a county board of elections has not had any contact with a voter for a period of two federal election cycles, then the voter will be sent a forwardable address confirmation mailing. The voter will be required to return the confirmation mailing within 30 days of the mailing. If the confirmation mailing is not returned by the voter within that time, or the mailing is returned by the postal system as undeliverable, then the voter’s record will be marked inactive in the voter registration database. Inactive voters are still registered voters. If an inactive voter presents to vote, the person will be asked to update his or her address with the board of elections. In the event that an inactive voter remains in this status for another two federal election cycles (meaning the county board still has no contact with the voter), then the voter will be removed as a voter in the county."
Now the dip in the graph (#1) made more sense. There was a big increase in voter registrations for the 2008 election (#5) when Obama won his first term, and if people hadn't voted in the four federal elections after that (#4, #3, #2, and #1) then their registration was purged. So it seemed people got excited and registered for and voted in the 2008 election, and then then lost interest after that and stopped voting (became inactive).
But...
As I studied the graph more closely, I noticed an even bigger dip after the 2014 election (#2). How could that be, since it was only three elections after the big one in 2008?!? And then I had my eureka moment! Perhaps many people had signed up during the "register to vote drives" in 2008 ... but they hadn't actually voted in the 2008 election (the best of intentions, but no follow-through). And then, being inactive in elections #5, #4, #3, and #2 their registration was purged after the 2014 election (#2).
It had never dawned on me that many people who registered specifically to vote for the 2008 election might not actually vote! Perhaps this is an important phenomenon people organizing voter-registration drives might should keep in mind - in addition to getting people to register, you need to get a commitment from them to actually go vote!
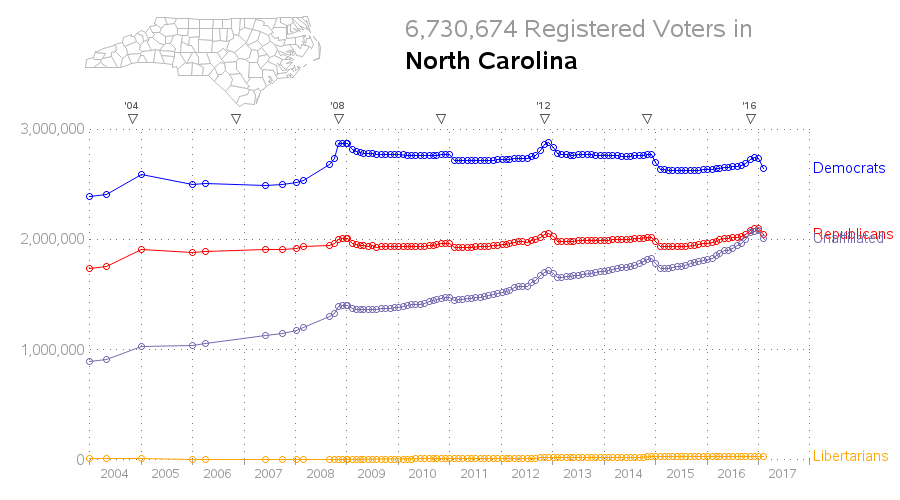
Here's a similar graph for the NC totals. The same trend is state-wide, but the after-election dips are a little smoother here because different counties tend to update their numbers at slightly different times. Click the image below to go to my webpage which has graphs for all 100 counties. You can navigate the graphs by clicking the counties in the map, or scrolling through the graphs alphabetically:
Hopefully my theory about the increases and decreases in the graph are correct, but if you have some alternate theories, feel free to share them in the comments section! (I know that some people get a bit passionate when it comes to elections and voter registration - but please remember to keep your comments civil and analytics-related!) :-)

3 Comments
Also interesting to note that there is no registration drive going on for the mid-term elections: no noticeable uptick in 2010, 2014, etc. That may be different this year, but we'll see.
Some voter registration entities do try to get new voters to sign a pledge to vote and try to follow up with them (although new legislation forbids keeping collecting information from registration forms, making that harder).
It would be interesting to know whether new registrants vote at lower rates than people who registered earlier, correcting for age (voting is pretty much a direct function of age). One assumes most new registrants are young people, who vote at really low rates. Back to the data, Robert!
It's a North Carolina law that counties must make their voter registration records available "electronically" -- which in the past might have meant "show up at the office with a floppy disk" but now in practice it means "internet".
Ahh - interesting details!