A topic that's been in the news a lot lately is the presidential power to grant pardons, commutations, and such. But all the articles I've seen just quoted numeric totals - I haven't seen a graph of the data anywhere! So I set out to find the data and graph it myself ...

First I had to find the data. After a few minutes of Google searches, I found what looks like a good/official source for the data on the justice.gov page (how did we get along before the Internet and Google?!?). The justice.gov site provides the data in tables such as the one below (each table varies a little, as they changed the data they tracked over the years).
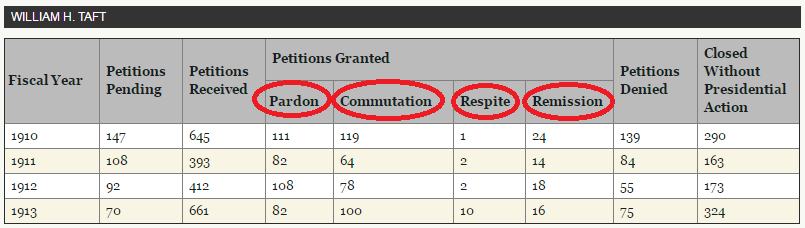
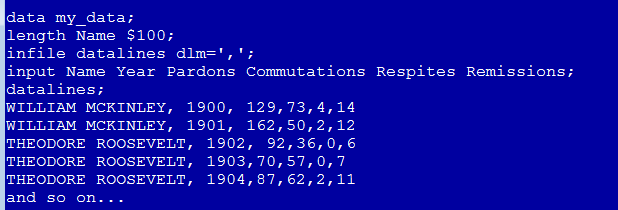
I meticulously copy-n-pasted the values for pardons, commutations, respites, and remissions for each year of each president, and encoded that information in the datalines section of my SAS job, so I could easily read it in and plot it. In 1945 (Truman) they dropped the 'Respite' column, and in 1964 (Johnson) they started abbreviating the column headers as 'P', 'C', and 'R' (I'll assume that 'R' stands for Remissions).
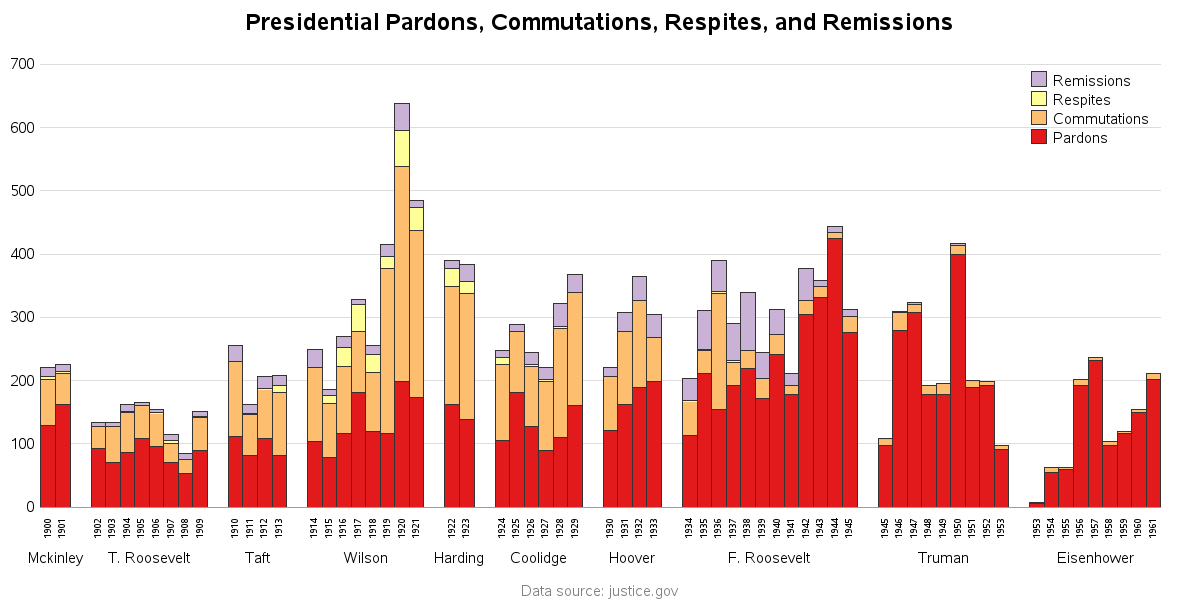
From a graphical perspective, there were several 'challenges' I had to consider. For example, not all presidents served the same amount of time. Some served one 4-year term, some served multiple 4-year terms, and some served less than a term (because of death, resignation, etc). Therefore, rather than plotting a total for each president, I show the total-per-year per president. I think this makes a more fair visual comparison (even though it splits some years into two bars).
Also, there was too much data to fit gracefully onto one page, so I decided to split it into two graphs. The first graph covers the years 1900-1961. This covers about 1/2 of the data, and I doubt there are many voters still living who voted for these presidents. I decided to use a grouped bar chart, grouping by president, and using the year as the bar 'midpoints'. Since pardons and commutations are the most important pieces of data, I used some data-tricks to make them stack at the bottom of the bars, so it will be easiest to track and compare them over time.
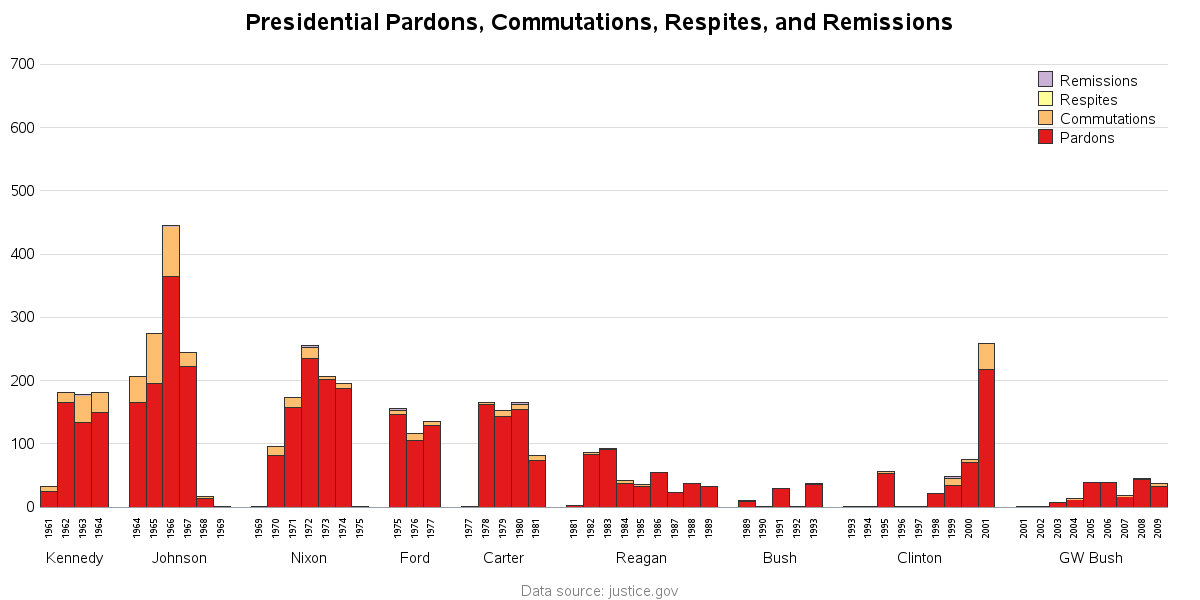
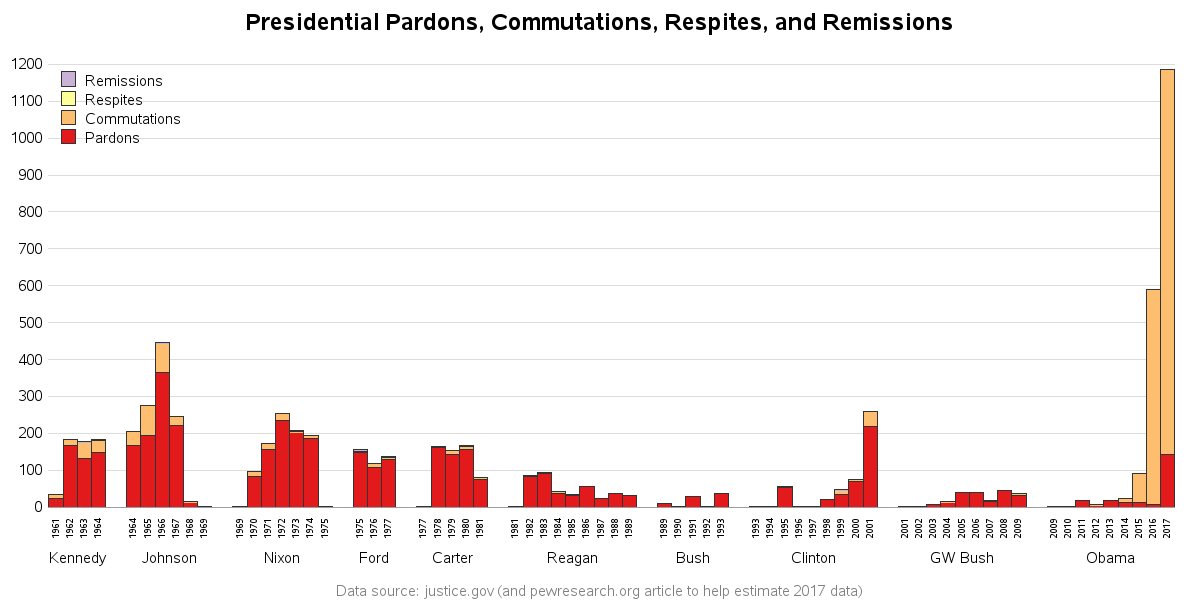
The 2nd graph is what I call the recent/modern presidents. These are presidents it is likely that someone still living/voting today might have voted for in their lifetime. Someone who was 21 years old in 1961 (21 was the minimum voting age back then) would be about 77 now. I plotted these to the same scale as the earlier presidents, so you can visually compare the two graphs - it's evident that in modern times, presidents have granted way fewer pardons and commutations than in the past.
You might be asking about president Obama, though ... Well, the justice.gov web page only had the totals up through 2016 (I assume they publish totals at the end of each year?), and therefore they didn't have all the data for Obama (no 2017 total). It wouldn't be a fair comparison to add him to the plot with incomplete data ... but I wanted to see how his numbers compared. Therefore I did some extra digging to try to find his numbers. I found a Pew Research article where they listed the grand totals for each president ... and if I can assume that the justice.gov tables are complete through the end of 2016, then in theory I can take the difference in Obama's Pew grand total and the justice.gov total, and that will be the 2017 values for Obama (212 total pardons - 70 pardons through 2016 = 142 pardons in 2017, and 1,715 total commutations - 672 through 2016 = 1043 commutations in 2017). If you have a definitive source that shows numbers different from that, please let me know!
Here's the graph using those estimates. Note that I had to increase the scale from 700 to 1200 in order to get Obama's values to fit.
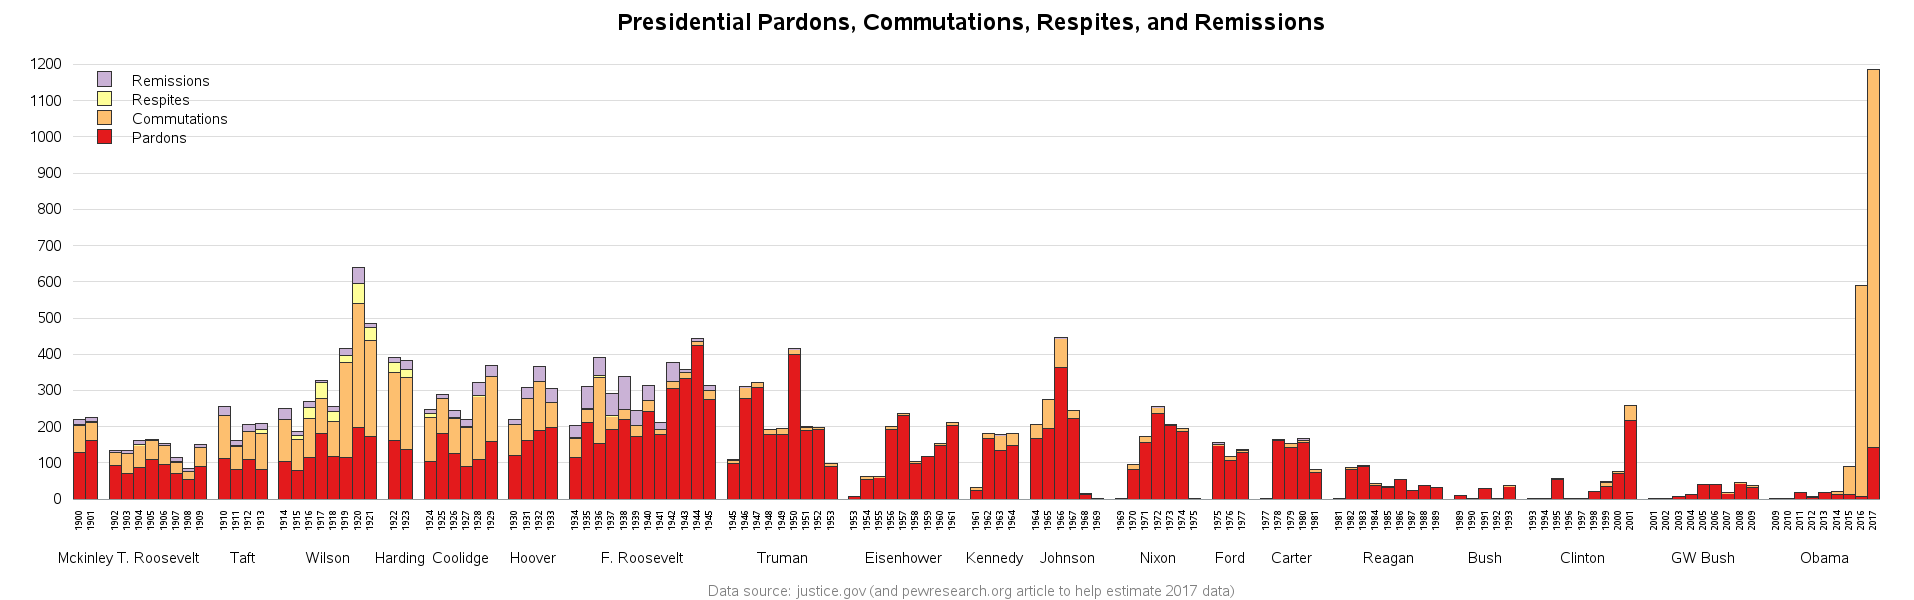
And now, it's only natural to want to see all the data in one graph. Although it's not ideal (from a visualization perspective) to plot more data in a graph than can be seen on one computer screen (and therefore you have to scroll it left/right to see the entire graph), it can still be useful. The image below is no doubt way too small for you to see the text and details, but you can click on it to see the full size graph that will let you scroll left/right to see everything in greater detail. (Note that you can click any of the graph images in this blog to see the full size interactive version, with html mouse-over text and drill downs. There is mouse-over text for the bar segments, the legend color chips, and even the president name labels along the bottom of the graph - they show the grand total values for each president).
So, how else might you plot this data, and what kinds of analytics could be useful to try? What trends do you see over time, and what factors do you think influenced the changes? Feel free to leave a comment with your thoughts (but please keep it civil, and let's not get into any nasty political debates!) :)
Photo credit: Mark Strozler - monopoly card // attribution: creative commons

3 Comments
Can you do a similar graph for deportations?
They have Obama's total now.
Fiscal Year Petitions
Pending Petitions
Received Petitions
Granted Petitions
Denied Petitions Closed
Without
Presidential Action
P C P C P C R P C P C
2009 (8.5 mos.) 1,040 903 232 1,086 0 0 0 0 0 132 120
2010 1,140 1,869 262 1,902 0 0 0 0 0 117 340
2011 1,285 3,431 331 1,585 17 0 0 872 3,104 84 389
2012 643 1,523 383 1,547 5 1 0 147 689 48 148
2013 826 2,232 303 2,370 17 0 0 314 1,577 44 240
2014 754 2,785 273 6,561 13 9 0 154 1,226 36 222
2015 824 7,889 294 2,999 12 79 0 142 782 6 915
2016 958 9,115 998 11,028 6 583 0 0 6,507 34 1,700
January 19, 2017
330 commutations granted
January 18, 2017
79 pardons and 2299 commutations denied
January 17, 2017
64 pardons and 209 commutations granted
January 13, 2017
804 commutations denied
January 6, 2017
1,161 commutations denied
December 19, 2016
78 pardons and 153 commutations granted
November 29, 2016
600 commutation denied
November 22, 2016
79 commutations granted
November 4, 2016
72 commutations granted
October 27, 2016
98 commutations granted
October 6, 2016
102 commutations granted
September 30, 2016
2,917 commutations denied
August 30, 2016
111 commutations granted
August 8, 2016
2,229 commutations denied
August 3, 2016
213 commutations granted
June 3, 2016
42 commutations granted
May 11, 2016
27 commutations denied
May 5, 2016
58 commutations granted
April 6, 2016
589 commutations denied
Hmm ... I see some individual day data for 2017 below the table, but I don't see an official 2017 total in the table.