Are you the lone-wolf SAS programmer in your company - managing the data, performing the analyses, and graphing the output for everyone else? And what's the only format they all know how to work with, and wish they had your output in? Let's face it ... that's probably an Excel spreadsheet!
Previously you had to jump through some hoops to send SAS graphs to an Excel spreadsheet, but now you're in luck! In SAS 9.4 (TS1M3), there's an easy new way to send your output (including graphs) to Excel. Directly to Excel! (Do not pass go, do not collect $200!)

Chris Hemedinger gave you a little preview of the experimental version of ODS Excel in SAS 9.4M1 and 9.4M2. And we now have the production version in 9.4M3! An astute user (Frank Tokic) actually brought this new feature to my attention, and provided an example of using it with SAS/Graph (thanks Frank!) I modified Frank's example to also demonstrate a few additional features, and I think it makes a great starting place for anyone interested in sending SAS output to Excel.
The example demonstrates:
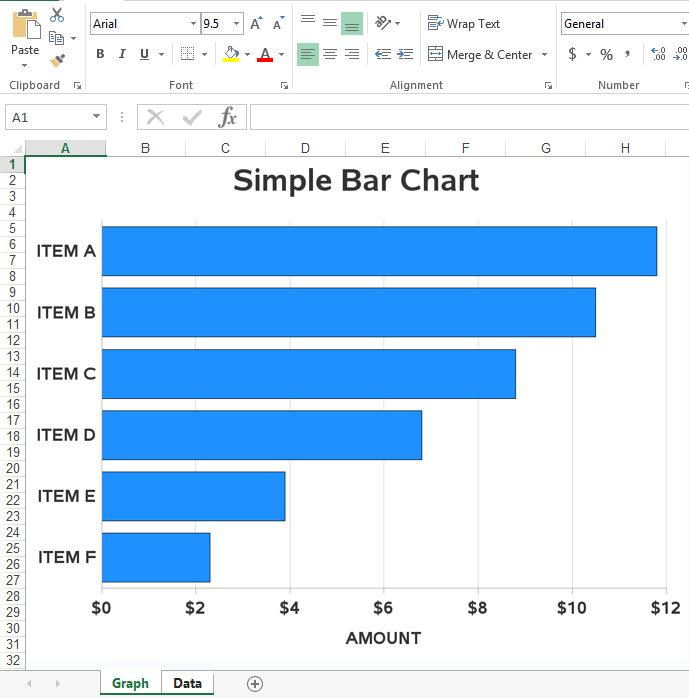
- Sending a traditional SAS/Graph Gchart to an Excel spreadsheet.
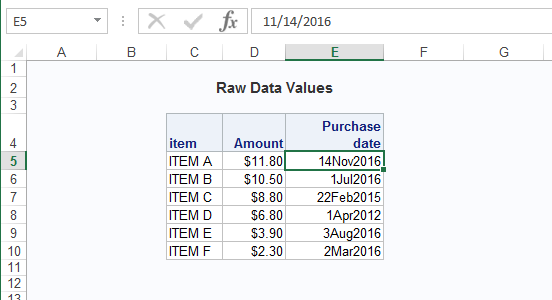
- Sending a SAS Proc Print table to an Excel spreadsheet.
- Starting the table at a specific row & column.
- Including the title text above the table.
- Using date-formatted data in the table.
- Writing the graph and table to separate sheets.
- And controlling the names of the sheets.
Here are screen-captures showing the graph and table in the spreadsheet:
I'm including the SAS code below, and also including links to the code and xlsx output files.
data my_data; input item $ 1-6 Amount Purchase_date date9.; datalines; ITEM A 11.8 14nov2016 ITEM B 10.5 01jul2016 ITEM C 8.8 22feb2015 ITEM D 6.8 01apr2012 ITEM E 3.9 03aug2016 ITEM F 2.3 02mar2016 ; run; ods listing close; ods excel file="excel_sas_graph.xlsx" style=htmlblue; goptions gunit=pct htitle=6 ftitle="albany amt/bold" htext=3.5 ftext="albany amt/bold" ctext=gray33; axis1 label=none value=(justify=right); axis2 label=('AMOUNT') order=(0 to 12 by 2) minor=none offset=(0,0); pattern v=solid color=dodgerblue; ods excel options(SHEET_NAME='Graph'); title1 ls=1.5 "Simple Bar Chart"; proc gchart data=my_data; format amount dollar5.0; hbar item / discrete type=sum sumvar=amount nostats maxis=axis1 raxis=axis2 noframe autoref clipref cref=graycc; run; ods excel options(SHEET_NAME='Data' EMBEDDED_TITLES='yes' START_AT='3,2'); title c=gray33 "Raw Data Values"; proc print data=my_data noobs label; label purchase_date='Purchase date'; format amount dollar5.2; format purchase_date date9.; run; quit; ods excel close; |
Hopefully this example will get you started with the basics. ODS Excel is pretty new, and therefore I'm not an expert (yet), but hopefully the documentation will answer most of your questions. And if that doesn't satisfy all your curiosity, I'd recommend posting your question in the SAS community pages.
- Image credit: modification of photo by Chris Potter // attribution by creative commons

15 Comments
is there anyway to update new tab without disturbing other tab please?
Hmm ... I'm not sure on that one!
How can we keep the graph and the data in one sheet on separate cells to start from that we can specify?
I don't send graphs to Excel often, so I'm not sure. Perhaps a good question to post to communities.sas.com!
I had the same problem that Leo had - I changed the START_AT value from "3,2" to "C2" and it worked just fine. Thanks for the great tip!
I assume the graph is just an image. My users always want to mess with the graph later. I know they can do some reformatting with Active-X. Often they are just happy with rescaling. Can SAS/ODS output SVG to Excel and can Excel then display it? SVG rescales well (the clue is in the name). Are there other possibilities such as a metafile picture format? (I'm migrating to 9.4 soon.)
The Graph Displays when using SAS EG 7.12HF5 provides the Graph Format Option under :
Tools-->Options-->Graph-->Graph Format is set to GIF or PNG instead of ActiveX
Thanks Prashant!
You can also alter the code (instead of changing the app options):
Put "dev=png" on the GOPTIONS statement
Be sure to change the FILE= value on the ODS EXCEL statement to direct to a path that you can write to in your SAS session (which might be on a remote server).
Hi Robert,
I just tried the code. in SAS EG 7.11 (I think Ive BASE 9.4) I received 3 errors after the proc print.
ERROR: In event 'output': ?:0: attempt to index a nil value
stack traceback:
?: in function 'start_worksheet'
?: in function '?'
?: in function
(tail call): ?
2 more errors were produced which I can post if necessary. The file was created but it needed recovery on opening and then Excel said it was corrupt.
Do you have any insight into the issue?
Thanks,
L
I wrote my SAS job as a stand-alone job, with all the ods statements and such hard-coded. EG generally wants to put in all the ods statements (and others) for you, so I doubt my stand-alone job will work in EG. Perhaps post to the EG forum in the SAS Cummunities site, and see if they have some tips. Also, it would be important to know exactly which version of SAS you're using in EG (you need 9.4 Maintenance 3).
Another possible problem - did you copy-n-paste the code from the blog, or download the .sas file? If you copy-n-pasted, maybe try downloading the file instead (sometimes copy-n-paste can corrupt certain characters).
Like Leo, I also tried the code in SAS EG (version 7.12 HF5). The Excel file was created with no corruption issues for me, but the bar chart did not show up. The 'graph' excel tab was left blank, though the proc print did show up correctly.
I tried the same code in base SAS and it worked with no problems. Is this a documented problem for SAS EG that the proc gcharts don't show up in the output Excel files?
Sorry, but my code just isn't written to run as-in in EG. EG does things 'differently'.
I don't use/know EG, so I can't provide any advice there - maybe an EG expert will answer, or perhaps post the question in the SAS Communities forum.
Update
- I ran the code in base sas and got the same error
- I did copy and paste the code so I re ran using the file rather than a copy/paste
Same error. There is something about the formatting of the numbers that is causing a problem.
I played around with the ods excel and it works create. I really don't like XML output that ExcelXP produces.
Thanks
L
Did you try Prashant or Chris Hemedinger's suggestions (in the comments below)?