Are you caught up in the recent Pokémon Go craze? Or maybe just trying to figure out what all the fuss is about? In this blog post, I try to analyze all the important Pokémon-related data in one graph!
When the original Pokémon game first came out around 1995, you needed a pair of Nintendo Game Boys to play it. The most recent release is played on a smartphone (which just about everybody has), and utilizes features of the phone such as GPS location, being connected to the Internet, the phone's camera, and the ability to combine pictures of the Pokémon creatures with real world images (augmented reality).
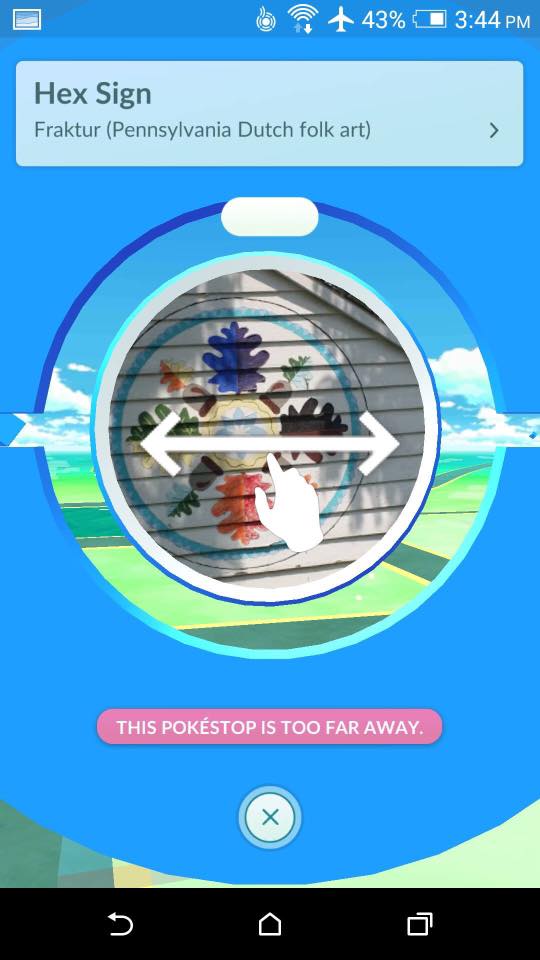
My friend Kara has a piece of her artwork on public display, and it has become a Pokéstop for a Paras Pokémon. Here's the augmented reality picture:

And now, on to the analytics...
Being a data person, I set out to find all the important information about Pokémon, and analyze that data graphically. After researching the entire Internet, I realized that just about the only important data is Nintendo's stock price (sorry Pokéfans, but when it comes right down to it, that's about the only thing that's important! LOL)Graphical analysis of all the important Pokémon data #PokémonGO Click To Tweet
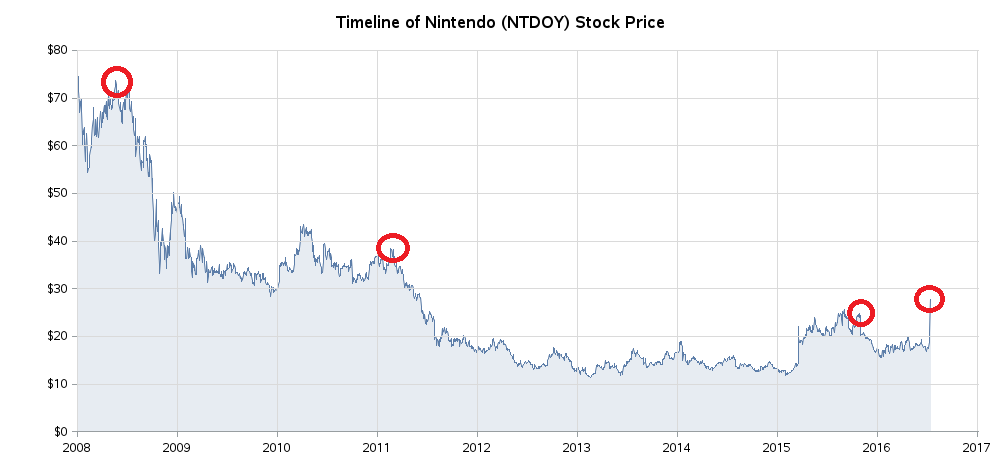
Nintendo's stock price has skyrocketed after the Pokémon Go game was released (Nintendo owns a 33% stake in the Pokémon franchise) - presumably under the speculation that this game signals Nintendo's successful entry into the smartphone app games arena. Many articles showcase the jump in stock price, using a graph something like this:
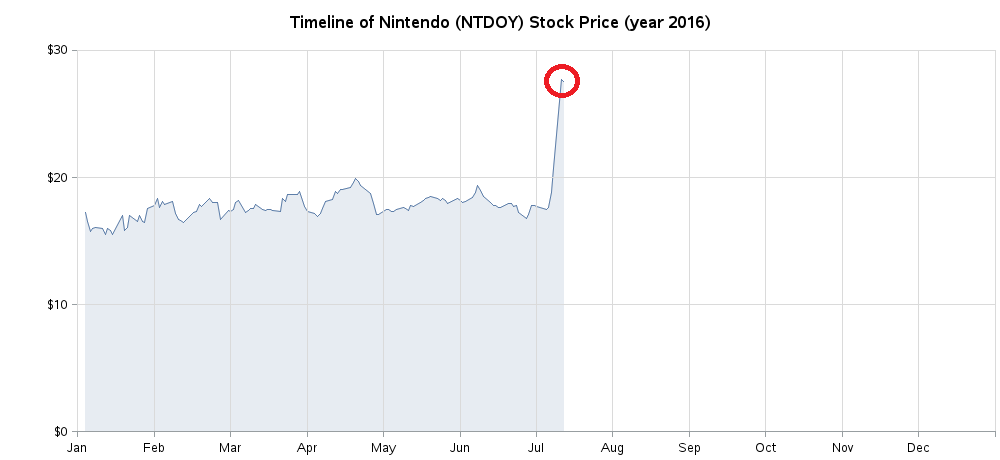
Wow ... that's quite a jump in the graph! But, if you plot a little more data, you might be surprised to find that Nintendo's stock price was about at that same level last fall.
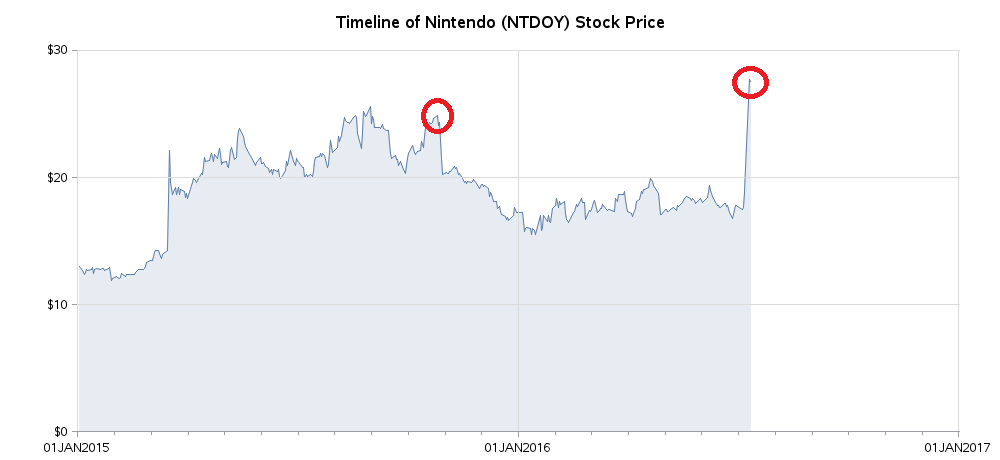
And if you go back a little farther in time, you will see that Nintendo's stock price was considerably higher in 2011.
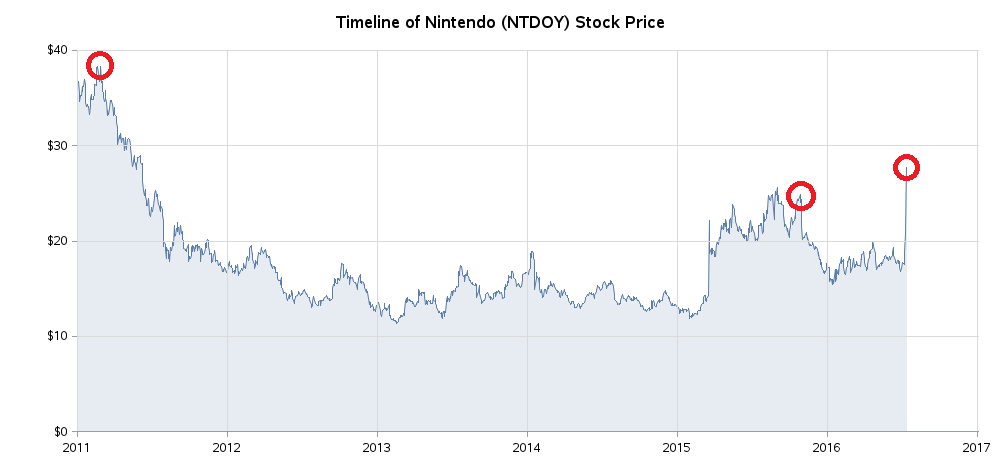
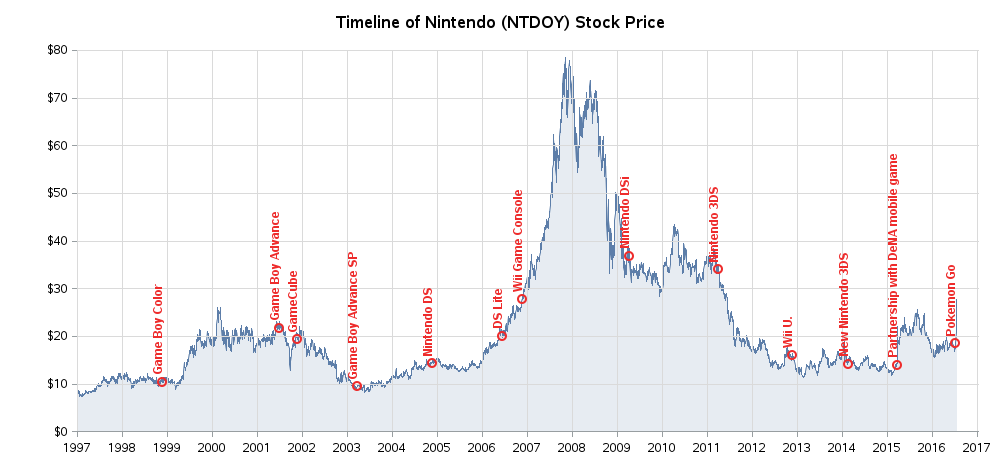
And if you go back a few years more, you'll see that the 2008 stock price was about double the 2011 stock price! Yes, a big percentage jump is important ... but in the grand scheme of things, Nintendo still hasn't even come close to making up for the stock price drop(s) that happened after the 2008 recession.
If you go back even farther, you will see that 2007/2008 was Nintendo's peak, and it came right after the release of the Wii game console. The Wii had some very popular games, and a revolutionary game controller that people really liked.
Will Nintendo's smartphone game apps be a repeat of the Wii's popularity? Time will tell!...

5 Comments
Pingback: Most efficient way to find rare Pokémon - SAS Learning Post
Pingback: Pokémon: Gotta graph 'em all! - SAS Learning Post
This is more click-bait than analysis... 5 static graphs? Could have at least created a slider.
Mark - Perhaps my latest Pokemon blog will make up for it! :)
http://blogs.sas.com/content/sastraining/2016/07/15/pokemon-gotta-graph-em-all/
the word "Pokémon" is really popular in main business media/social media in China recently few days. probably just a hurricane, strong and sudden, then nothing... :)