Here in the US, our July 4th Independence Day holiday is coming up. It's a festive holiday with lots of fun & fireworks, but you also need to also be careful ... and I've got the graphs to prove it!
Last year, I wrote a blog post about a SAS map that could help you find fun fireworks shows. This year, I've decided to focus more on the safety side of things, and created some graphs about fireworks accidents. Hopefully if you're aware of the accidents that can happen, you'll be less likely to have such an accident.
But before we get started, here are some fireworks photos from my friends, to help get you into the holiday spirit...
Here's a nice shot my friend David took:
I'm just going to say that some anonymous person sent me this next photo ;-)
My friend Margie has an impressive collection of earrings for every occasion - she's a real "firecracker" and here are some of her earrings for July 4th!
And for the grand finale, here's a really nice photo of some fancy fireworks from my other friend David ...
Now, let's do some data analysis!
When it comes to accidents and injuries, one of the better sources of data out there is the Consumer Product Safety Commission. A few months ago, I used their sampling of emergency room data to show some statistics about lawn mower accidents. I recycled the same SAS code, and used it to plot accidents associated with fireworks.
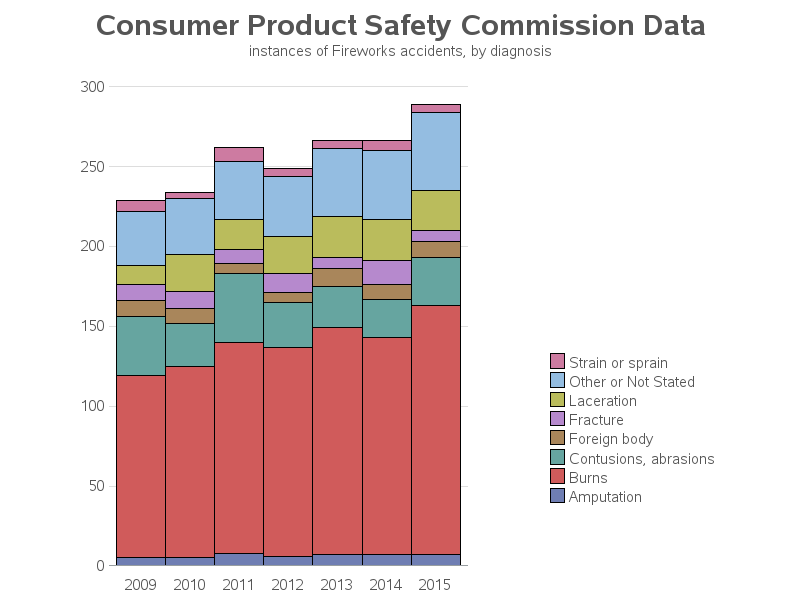
Let's start with a simple bar chart, to see what kind of injuries happen most often. Remember - this isn't all of the accidents, but a random sample of the ones that showed up in the emergency rooms. It appears that burns (the red bar segment) are the most prevalent type of injury, by far.
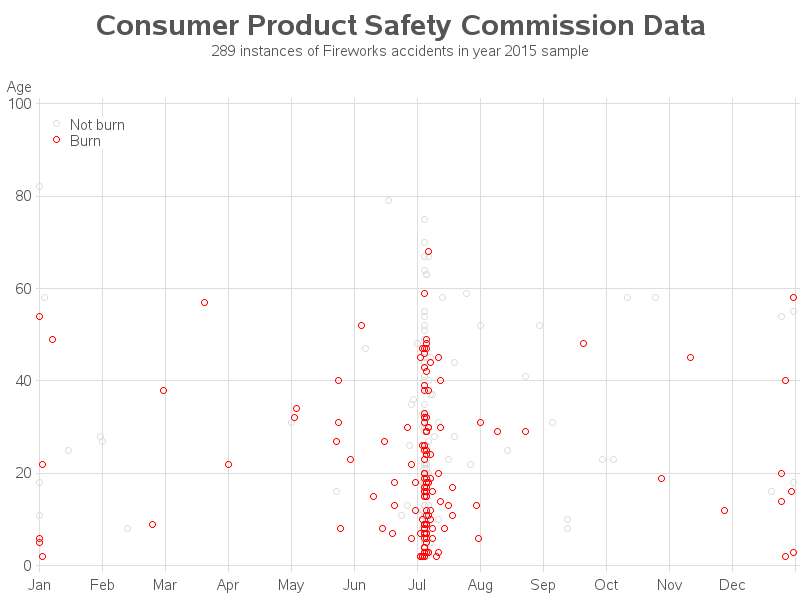
Now, let's look at burns versus all other fireworks accidents for the year 2015. As expected, most of the accidents are around the July 4th holiday. I was a bit surprised to see so many accidents involving children under 10. Upon reading the descriptions, I found that many of the young children were hurt by sparklers (and many of those accidents involved the child grabbing the sparkler after it had finished burning). So, be careful with your fireworks before, during, ... and even after using them!
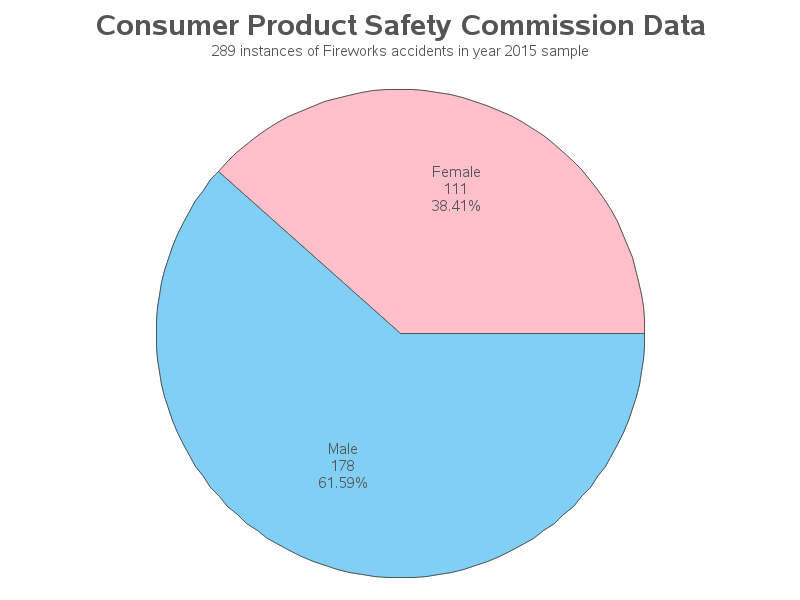
When working with the lawn mower accident data, I was not surprised to see that over 75% of the accidents were males (mowing yards isn't exclusively a male thing, but I definitely see more males mowing grass, than females). I was curious to see if the fireworks accidents were skewed towards one gender or the other, so I created a pie chart. Looks like it's about a 60/40 split, with males having the most fireworks accidents as well.
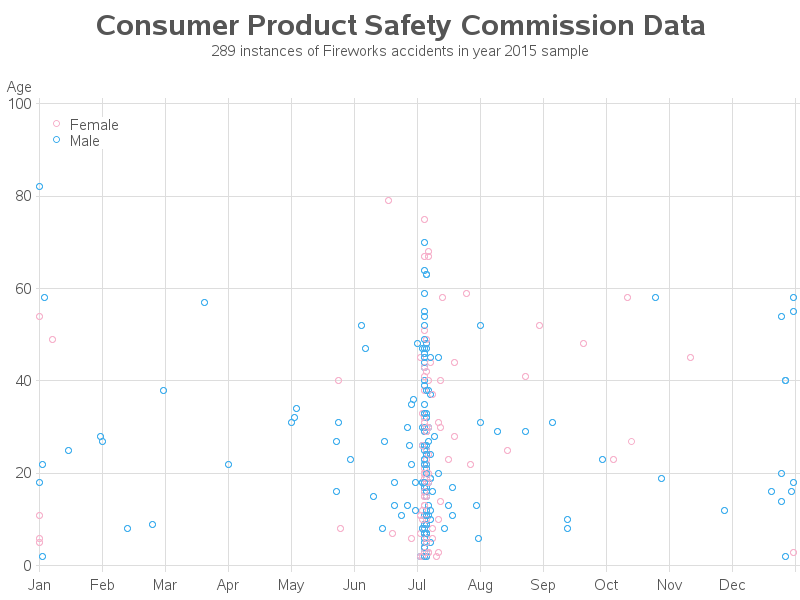
I was curious to see if there were any other gender-based trends in the data, so I plotted all the 2015 fireworks accidents in a scatter plot of age-vs-date, and shaded the markers by gender. But I was seeing a lot more blue (male) markers than I thought I should (more than the expected ~60%). After studying the graph a bit, I found that this was a side-effect of how the 'plot age*trmt_date=sex' automatic graphing works ... the colored markers for the values of sex get stacked/overlayed in layers, and the blue male markers were all showing in the top layer (obscuring many of the pink female markers).
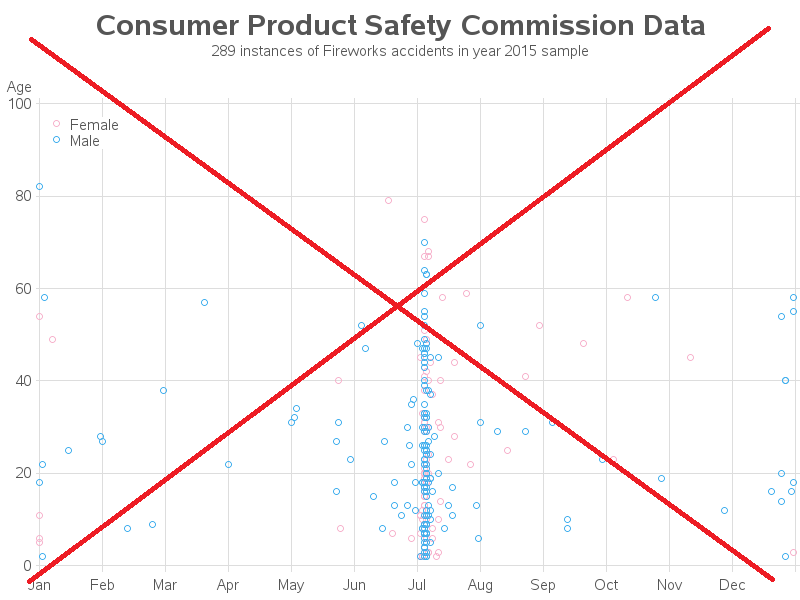
Therefore I did a little extra coding, and annotated the blue and pink markers (instead of using the automatic overlay), which allows them to stack in the order they occur in the data. This version of the plot isn't visually biased towards blue (male) like the previous one. It's a subtle difference, but I think it's an important one. You might not notice the difference at first, but if you look very closely it will jump out at you.
And now it's your turn ...
- Do you have any advice for shooting off fireworks safely?
- What fireworks do you recommend?
- How do you recommend 'holding' them?
- What do you recommend using to light them?


6 Comments
Pingback: Finding July 4th fireworks shows with SAS software!
During my research for this blog posting, I found this related video: https://www.youtube.com/watch?v=iPZijDUt_u0
That's a whole lot of gunpowder to have hanging on your arms! Yeow!
Yep! I couldn't look away, but then again I kept wondering if he was going to end up as a statistic in the CPSC data!
Most Common Last Words Spoken
 Count  Phrase

-----------------------

 12873  I see a light

 47809  I love you

763412  Hey, watch this!
Would be interesting to know mortality associated with fireworks. Remember this from last 4th of July? http://www.telegraph.co.uk/news/worldnews/northamerica/usa/11719676/Man-dies-instantly-after-launching-firework-from-his-head.html