Are you afraid that if you take a ride in a taxi, you might get "taken for a ride"? If trying to figure out the reasonable price of a taxi is a bit voodoo/black-box to you, here is a SAS data analysis of over 12 million NYC Yellow Cab rides, that will hopefully get you in the right ballpark!
Before we get started, here's a picture of a taxi I saw on my trip to Cuba last fall - I've never been to NYC, but I imagine taxi rides are a little different there! :)

I recently came across an interesting graph posted by reddit user 'badgraphs' that analyzed ~1,000,000 NYC Yellow Cab rides from January 2015. His goal was to estimate the "effective rate for an average yellow cab trip in NYC" ($/mile). Below is a copy of his graph:
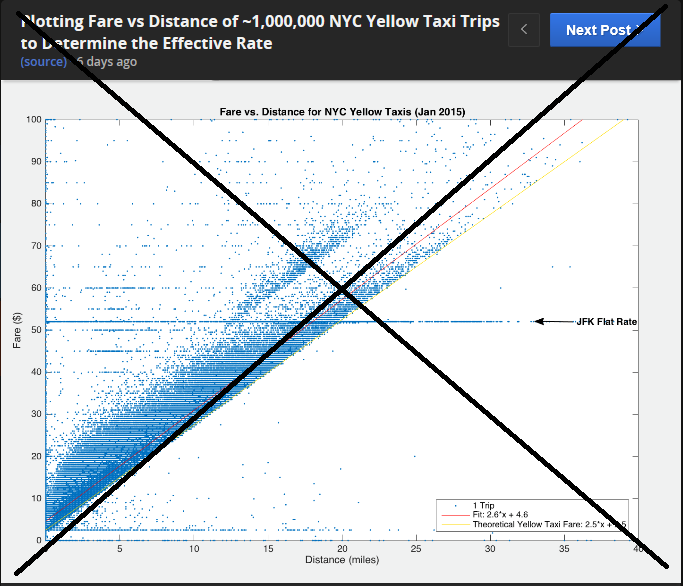
I found his graph interesting (mainly because I had no idea that this detailed data from all the NYC Yellow Cabs was available!), and the combination of his graph and his write-up answered many questions about the data. But I wondered if I could create a better graph, that was a little more self-explanatory, and didn't need an accompanying article to help users know what was going on in the graph.
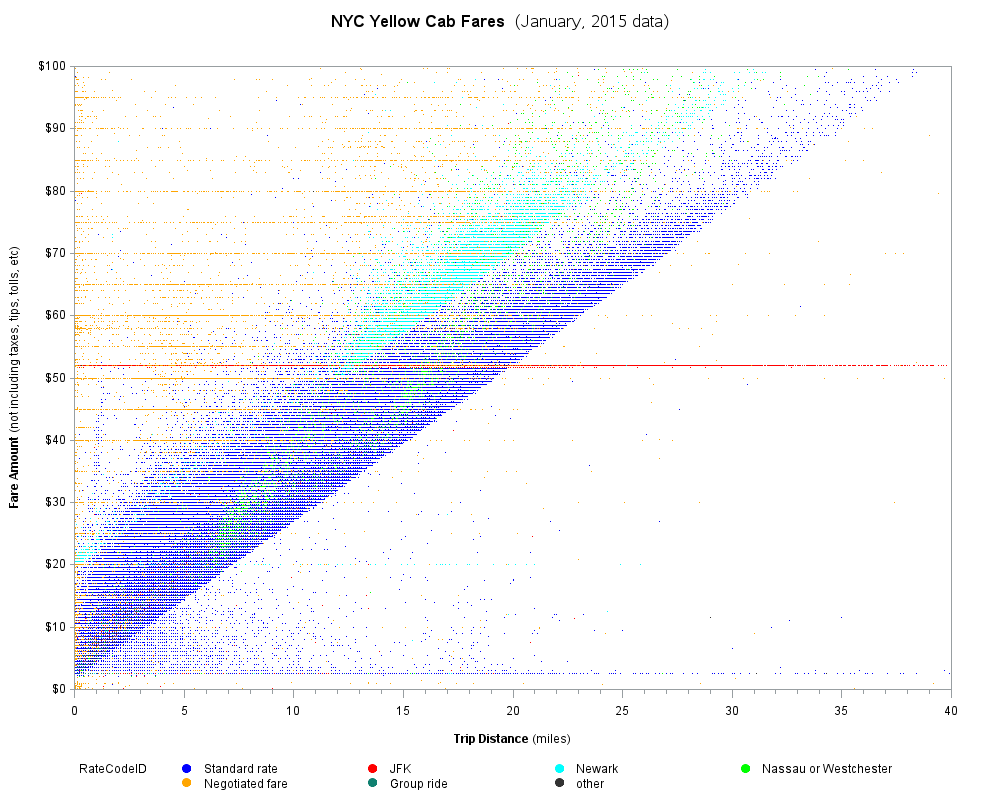
I located the data on the nyc.gov website, downloaded the csv file, and imported it into SAS. There were actually over 12 million rides in the data for January 2015 (whereas the graph above only plots ~1 million rides), and of course I included all 12 million in my graph, since SAS can handle that. I decided to let the data speak for itself rather than using regression lines and such, and I found it useful to color the data by the RateCodeID. The coloring helps explain several of the visual features in the graph.
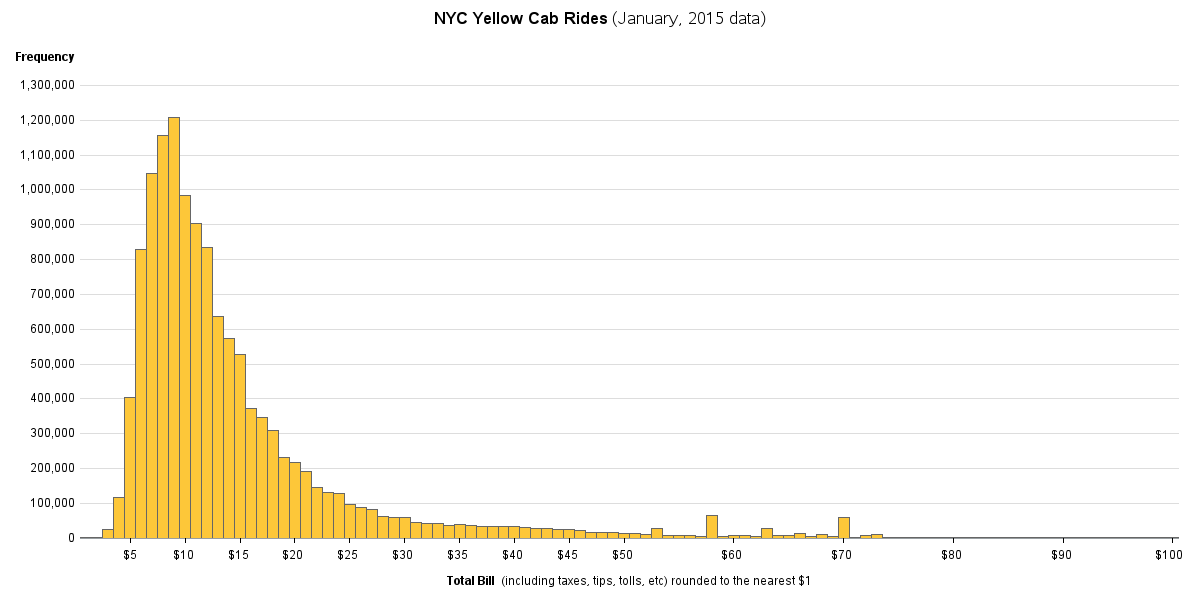
Showing the cab fare -vs- distance was interesting, but I had a more direct question ... how much do people generally pay for a cab ride? Therefore I rounded all cab rides to the nearest dollar, and created a histogram. Looks like the typical ride in a NYC Yellow Cab is around $9 (good to know, eh!?!)
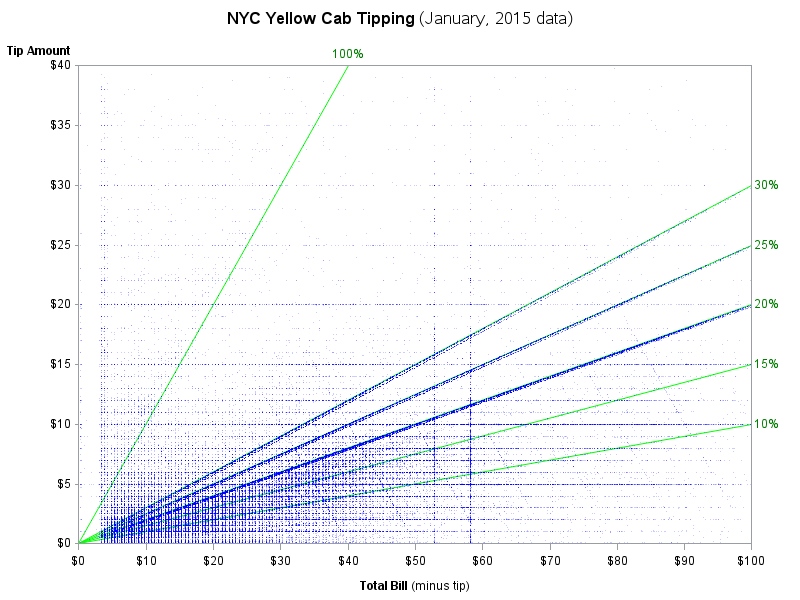
Inquiring minds also want to know ... how much do people generally tip a cab driver? Luckily, the tip amount was in the data, so I was able to plot the tip amount -vs- the total bill. I noticed some clear trends in this plot, and after annotating some green reference lines, I could see that people tended to tip amounts at even increments of 5% - and it looks like the most common amounts are 20% and 25%. How much will that taxi cost me? #analytics Click To Tweet
Hopefully these graphs provide you with some useful insight into your future taxi rides. And if you have access to data from other cities (or other ride services such as Uber or Lyft), I think it would be very interesting to see graphs of that data, and compare them to these NYC Yellow Cab graphs. Here's a link to the SAS code I used (data, graph1, graph2, graph3), if you'd like to download it to use as a starting point for your own graphs.


6 Comments
So what explains the correlation of faint blue lines that lean to the left?
The $40, 50, and 60 bill lines are easiest to see but I seem them all the way to the $100 bill.
Rick Wicklin dives into this data a little deeper, and explains the left-leaning lines as follows "The diagonal lines that slope down from the upper left are riders who give the driver a set amount and tell him to keep the change. There are clear lines in the full-sized graph for riders whose total bill (fare plus tip) was $20, $40, $50, $60, $70, and $100."
http://blogs.sas.com/content/iml/2016/05/02/new-yorkers-tip-taxis.html
Pingback: How much do New Yorkers tip taxi drivers? - The DO Loop
Talk about big data! 12 million rides in 1 month... A cinch for SAS to handle. Like the graphs you produced. Much more insightful. Does make me wonder how other major cities around the world compare?
Yep! - I'm not sure if everyone would consider 12 million observations "big", but this is "big enough" that it starts showing SAS' strength over a lot of the competitors that only handle thousands or hundreds of thousands of observations. (Note that I was even able to run my SAS code on a run-of-the-mill laptop!) :)
Your points exactly Rob. Especially if you wanted to analyze a few years worth of data. I'm not sure many vendors could handle that!