With the upcoming appointment of a new Supreme Court Justice, I wondered just how liberal and conservative previous justices have been. I found some data, and tried my hand at creating a graph to help visualize it...
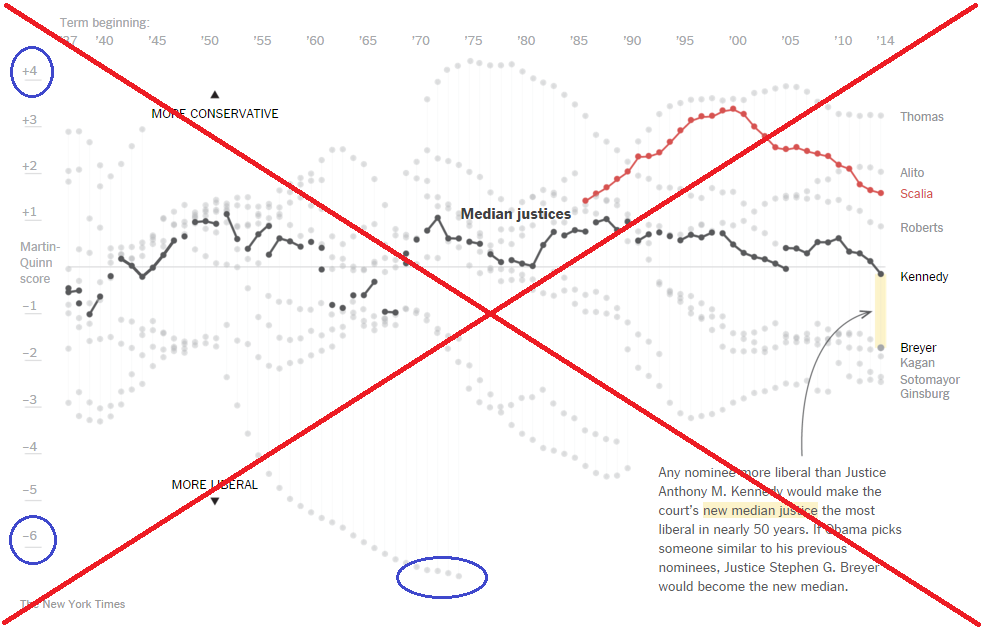
In my quest for data, I came upon an article on the NYTimes website that I found very interesting - in particular, the following graph. It caught my attention, but there were still a few things I thought could be improved (see my blue circles). For example, in a graph like this, I think it is important for the axis to be symmetrical around zero (whereas this graph goes from -6 to +4). Also, since the axis only goes to -6, it is difficult to know that the data values actually extend out past -6.5 (I would not have guessed that before I found the actual data table). Also, some horizontal reference lines would make it easier to see if the values are going up or down over time.
With a little searching, I found the data values on the berkeley.edu website, and downloaded the csv file. I wrote some code to import it into SAS, and then set about creating a plot similar to the one in the NYTimes article, but with a few changes to make it more straightforward and easier to read. Here's what I came up with (click the image below to see the full size interactive version, with html hover-text over each marker).
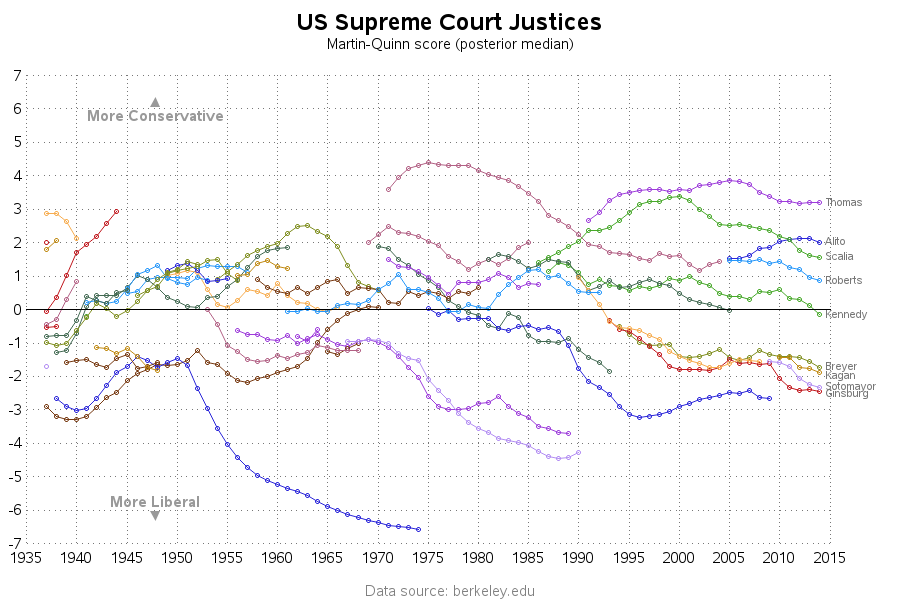
Notice that my vertical axis is symmetrical about zero, and extends from -7 to 7 (which encompasses all the data values). I added horizontal and vertical reference lines, which make it easier to track small changes in the data over time. I made each Justice a different color, to make it easier to track a Justice over time. I think it's a nice simple plot, that shows the data well.
But as I studied the line plot, I noticed sometimes multiple lines overlap, or nearly overlap. When this happens, it seems to 'lessen' the visual impact. For example, in recent years, the liberal Judges are mostly clumped together, whereas the conservative Judges are more spread out. Therefore I decided to try to create a graph that isn't impacted by overlapping lines. I decided to use a stacked bar chart.
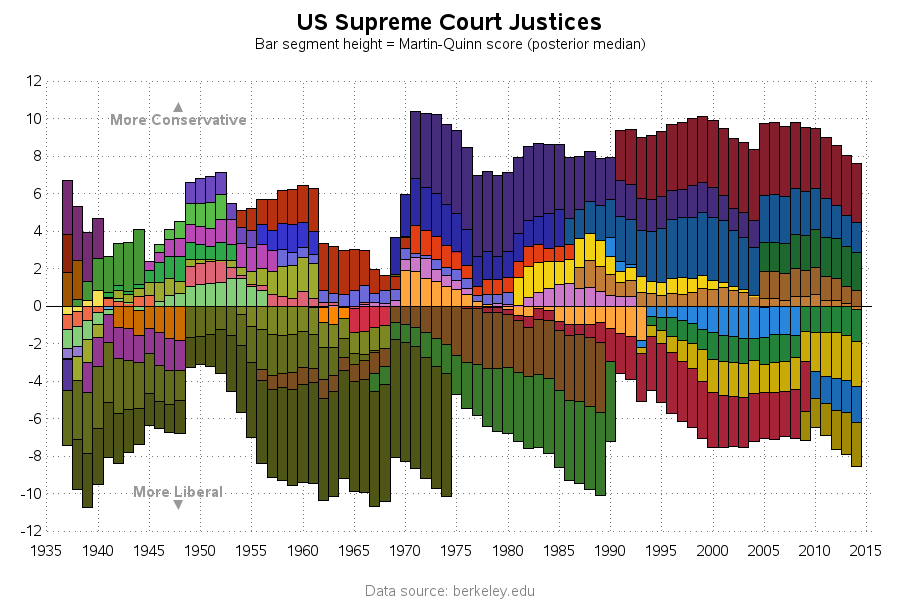
I don't think that either graph is the best way to view the data, but as I have pointed out before I believe it is always best to view the data in several different ways.
Do you think the graphs accurately represent the data? Did any of the trends in the data surprise you?


7 Comments
Pingback: My top 10 graph blog posts of 2016! - SAS Learning Post
Interesting trend: All but two of the nine justices serving during WWII made progressively more conservative decisions as the war carried on, whether they were already conservative or liberal. A prime example would be the Hirabayashi and Korematsu Japanese-American internment decisions, which Douglass later stated was his one regret while on the Court (he's that very bottom line terminating in 1975). The court is not immune to changing social conditions.
On the same topic, but a much simpler graph:
https://en.wikipedia.org/wiki/List_of_Justices_of_the_Supreme_Court_of_the_United_States#All_justices
The wrapping order by timeline does not seem to add enough value to be worth the complexity to me. A gantt chart (proc gantt?) seemed more appropriate. When I saw this, I thought: this is a job for Robert Allison!
Hmm ... I might have to give some attention to that graph, and see if I can come up with an alternate version! :)
Would be nice to have a legend for bar colors as it is not easy to match line and bars colors. Maybe it is just me?
Yep - but in these charts there are just too many colors to easily distinguish, so I suppressed the legend (users will just have to use hover-text).
In these charts, the use of the color is to allow the user to more easily 'follow' a Justice over time.