In “Explaining statistical methods to the terrified & disinterested: A focus on metaphors”, I discuss the usefulness of metaphors for explaining abstract statistical concepts to non-technical readers. This is an approach taken in my new SAS Press book, Business Statistics Made Easy in SAS®, since many readers of this level of book are non-technical, disinterested or downright frightened of statistics.
In this blog, I unpack one such metaphor for fitting mathematical models to data, which may be useful for instructors teaching similar material. This is taken directly from Chapter 11 of Business Statistics Made Easy in SAS®.
The star sign metaphor for fitting models to data
I like the metaphor of star constellations as a picture for data fitting. Think of the stars as data. Nothing in the stars is an exact pattern. But, sometime in history, some Greek turned around to his friend and went “Dude! Those stars over there look like a lion!” Take a look at this picture for the basic pattern of the stars of the constellation Leo.

The photo below shows a hypothetical picture of a lion laid over the stars – you may think of the picture as an exact perfect model of a lion. The stars do not follow the lion picture exactly, but perhaps they come close enough to give agreement that a lion is a good approximation of the pattern.
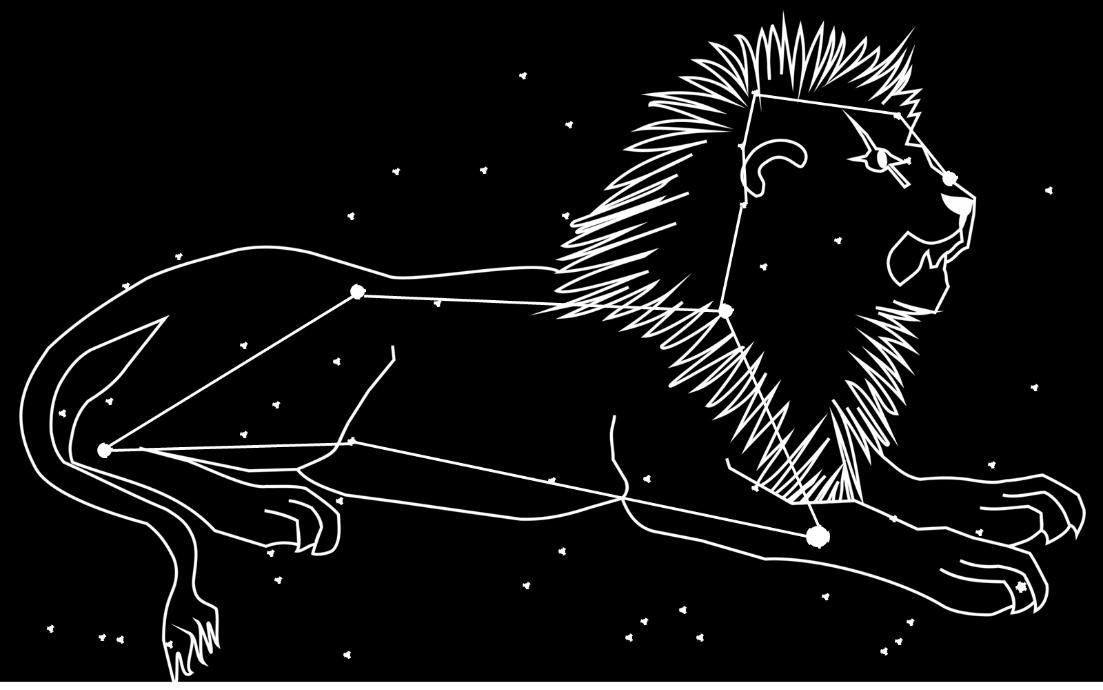
Your task would be to determine how closely the data (or stars) really fit to the picture of the lion. Plots and certain fit statistics would typically be available for this. If the data does not fit a lion, perhaps there is no shape, or perhaps some other shape will fit well (a dog? a car?). The final shape that fits may or may not be helpful to you – that would be another question, and is discussed in the next major step on interpretation.
Following up on this metaphor
I follow up on this metaphor in my book with more concrete examples of fitting a normal distribution to a single variable’s distribution and a linear line to a bivariate scatterplot.