Did you know you could drive 74 million cars using the wasted natural gas that is flared from oil wells and refineries? Learn more details in this blog post!
Flaring (burning) is commonly used to dispose of natural gas produced at oil and gas facilities that lack the infrastructure to capture it all. If you've ever been around an oil field, you've probably seen the flares burning (they're especially visible at night). How much potential energy is wasted by flaring the gas instead of capturing it? ... A lot!
Here's a picture of the flame in my gas furnace at home. I wonder how long I could heat my house, using all that natural gas wasted in flaring? ... Millions of years, no doubt!

While perusing the Internet for data to plot, I came across an interesting study where they identified the locations of oil wells, refineries, and natural gas processing facilities that flare natural gas. In their study, they created the following map to show the locations:
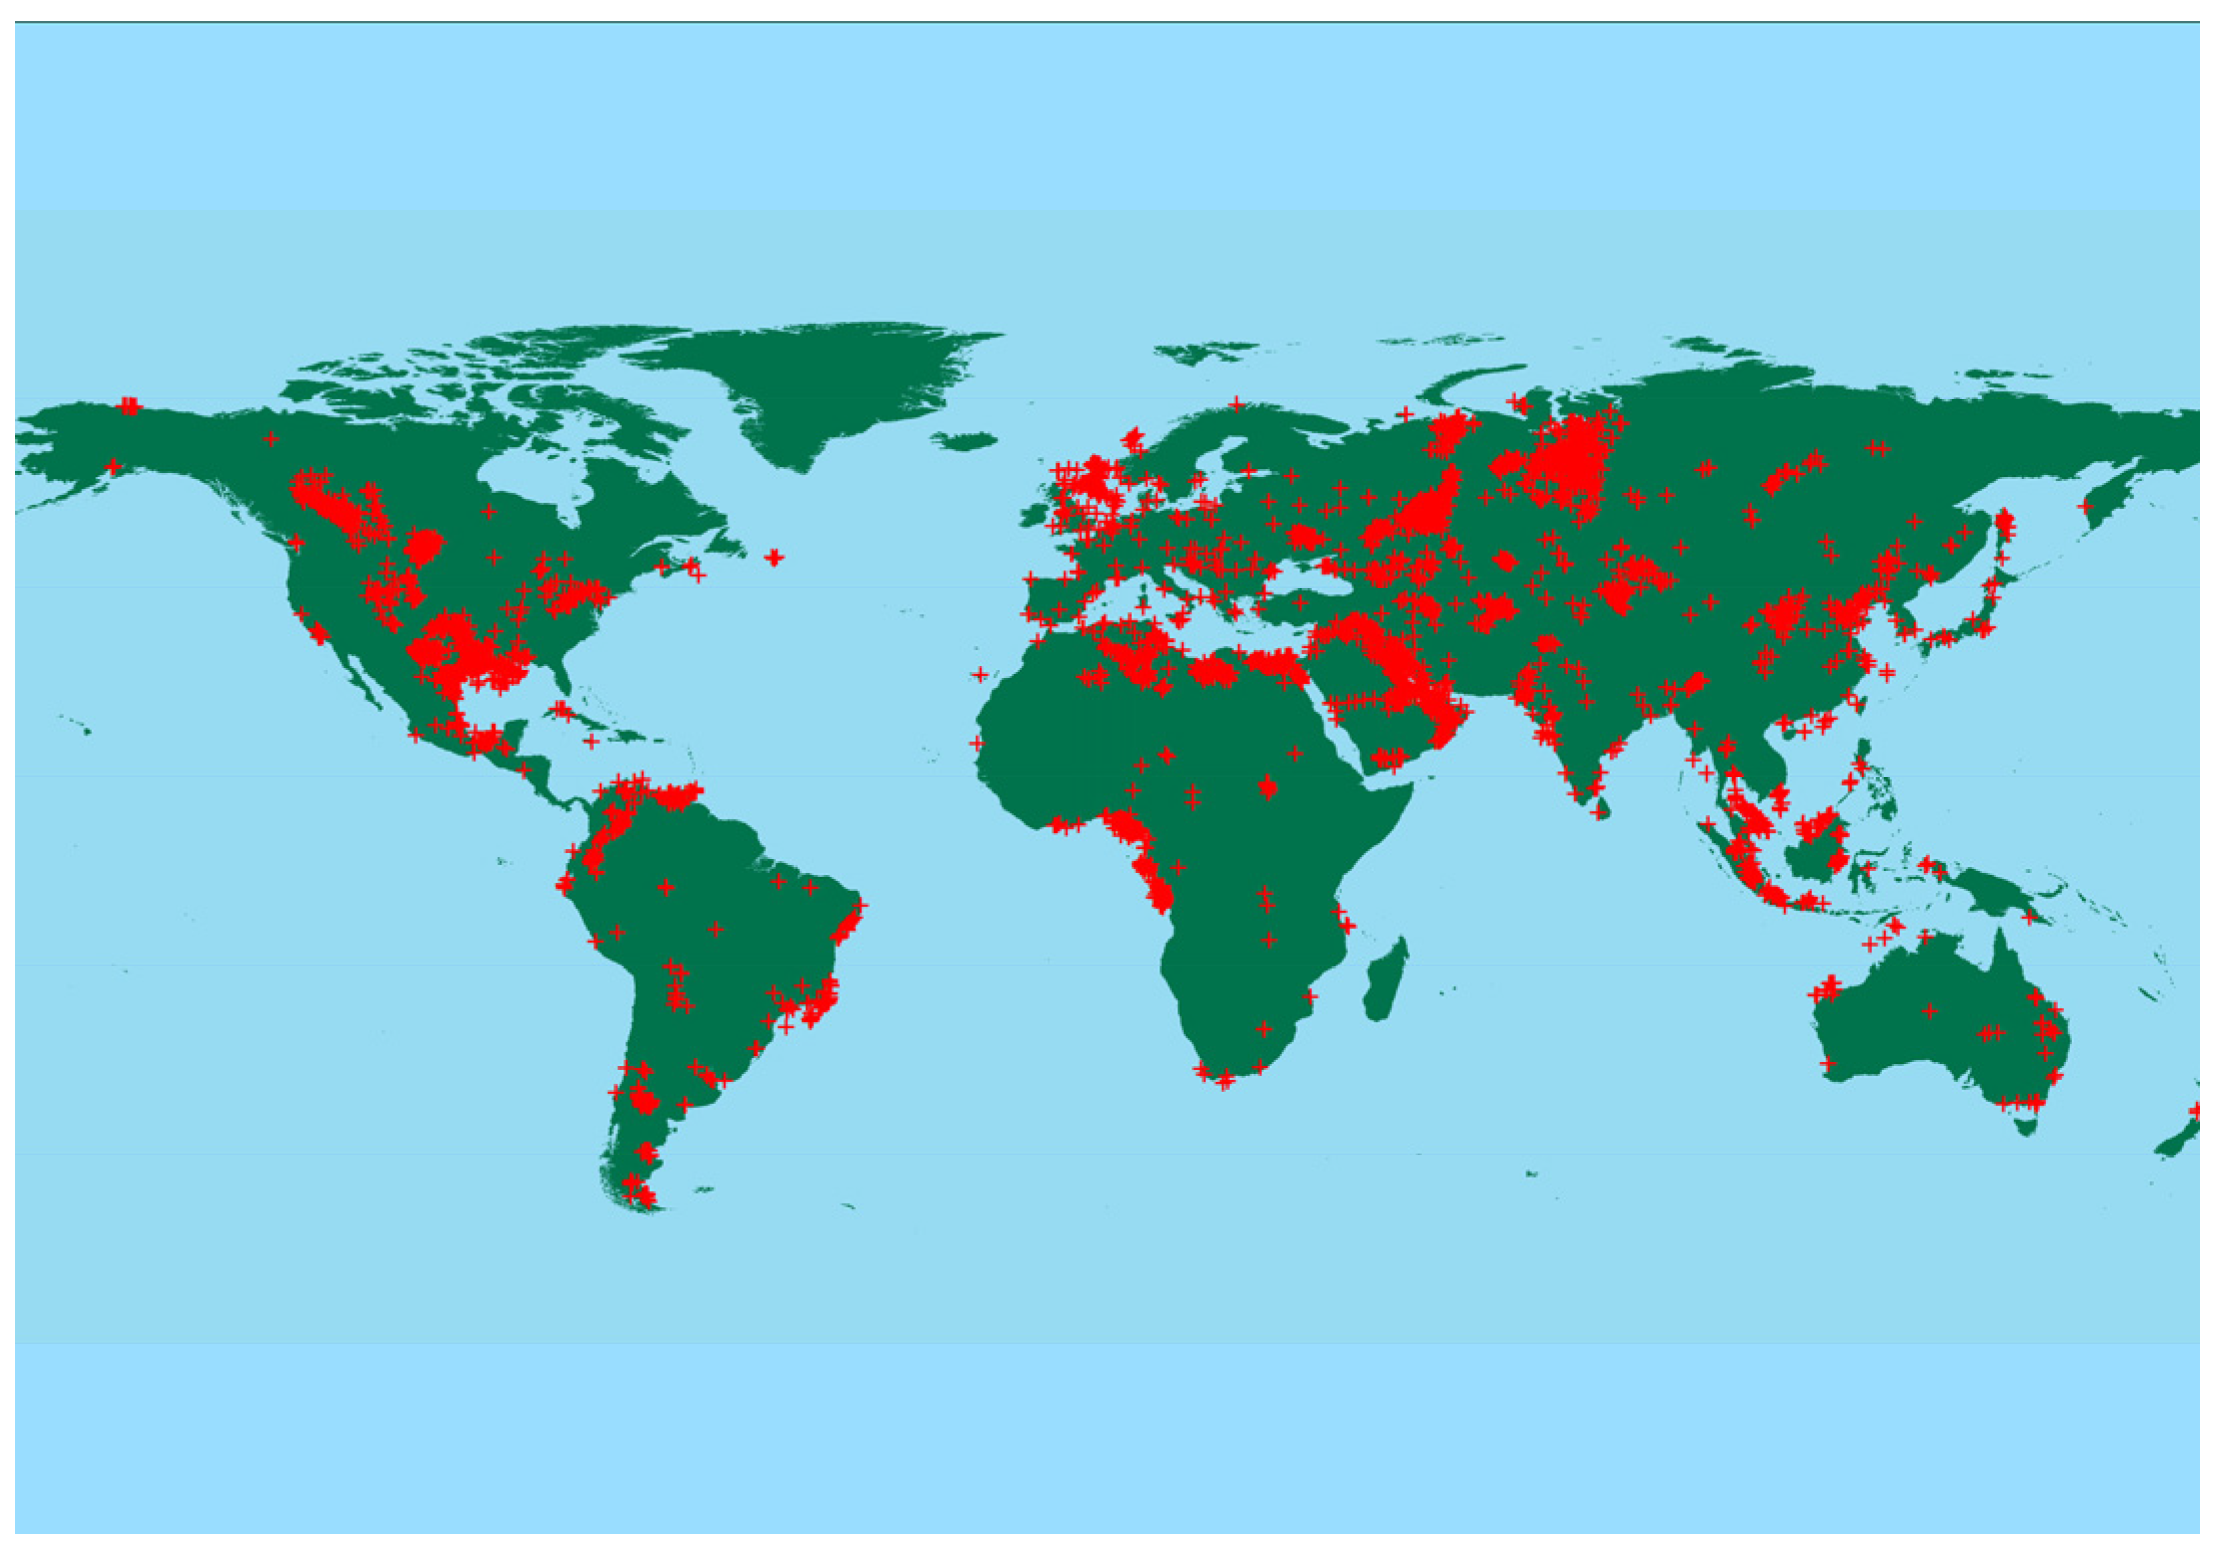
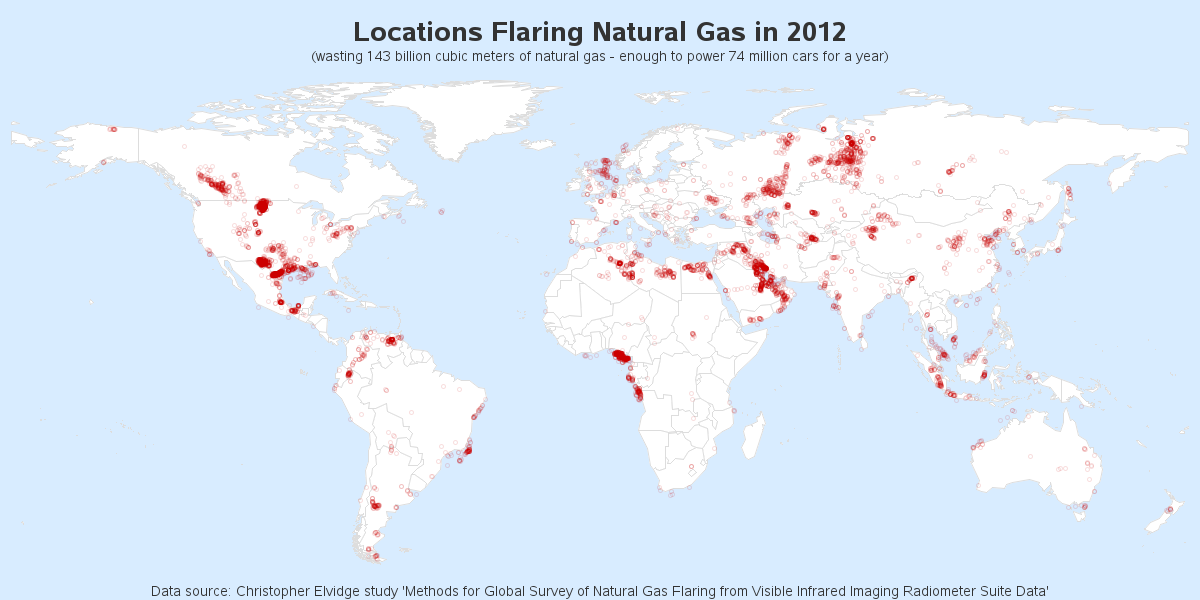
It was an interesting map, but I noticed a few opportunities for improvements. First, the red & green colors might not be the best choice. Also, it appears there are a lot of overlapping markers in some areas, but it was difficult to tell exactly how much overlapping. I decided to create my own SAS version, and use lighter map colors (so the flaring locations would stand out more), and also use transparent colors for the markers (so it would be more evident where the flaring locations were more densely packed).
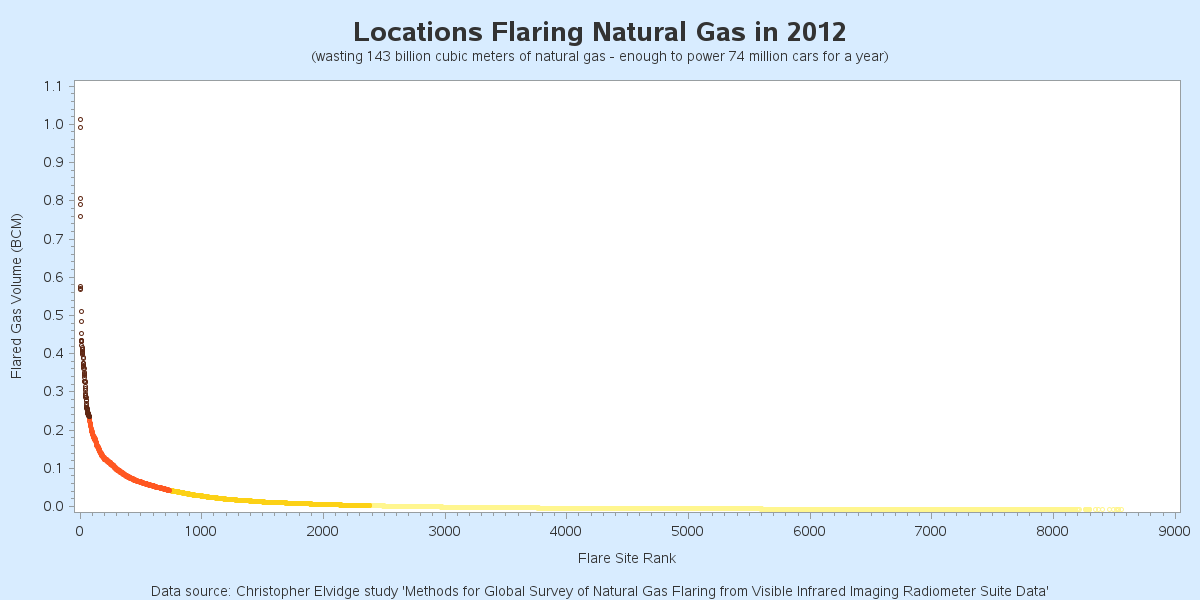
Upon looking at the data available in their kml file, I noticed some additional values other than location. There was also a variable showing the estimated billion cubic meters (bcm) of gas flared. I plotted that data, and found that a small handful of the locations flared the majority of the gas. I experimented with various colors, and came up with a gradient shading that seemed to fit the data well.
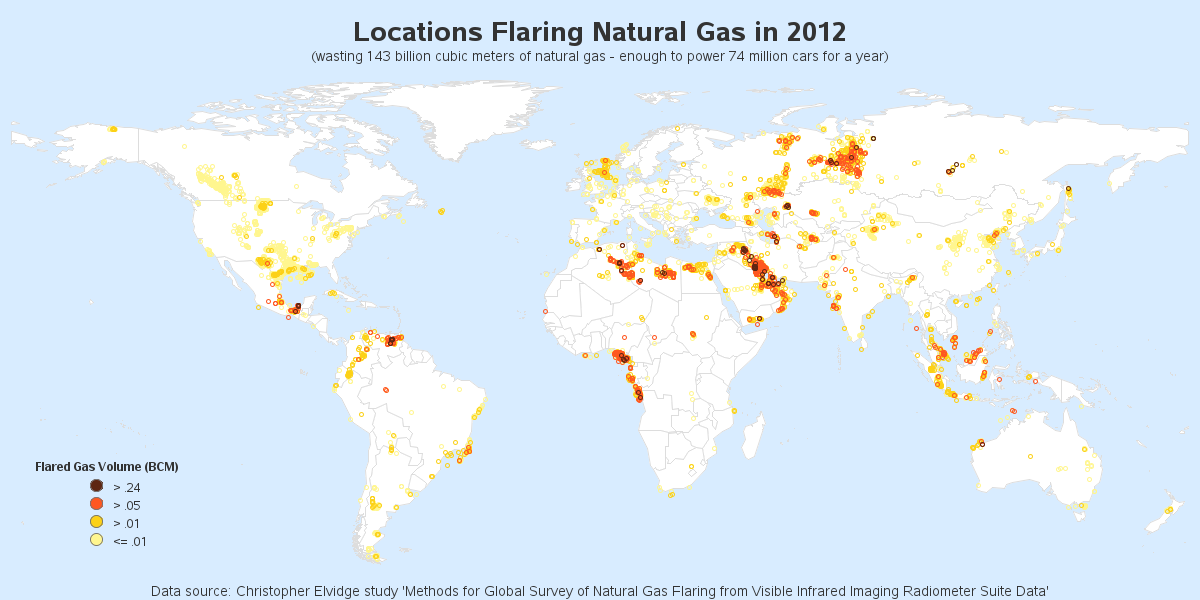
I then applied the gradient color shading to the markers on the map, and I think it is much more informative than the original one. You can glance at it and see exactly which areas are venting the most gas (I was happy to see that the US vented less gas than most of the other big oil producers). In the study, they estimated that 74 million cars could be driven each year, using the energy wasted in flaring natural gas. Wow - that's a lot of wasted energy!
I don't know if it is economically feasible, but it sure would be nice if we could capture all that natural gas instead of venting it, eh?!? Like my mama always said - "Waste not, want not!"


7 Comments
If those countries stopped flaring gas and same value of amount could supports African nations who surviving day with just a 1$ could help global to reduce poverty level so why not these Oils and Gas producer countries think about it ??
Richer are getting richer because they are educated and investing money where they can money makes money but how about poor peoples they even dont have basis educations.....So here is my humble request to those multi Billions individuals to re think about this......
Nice idea!
I was surprised to see that Japan is flaring natural gas. I thought they had no oil/gas.
When I hover over Alaska it shows United States. When I hover over the 48 nothing shows. I also see Russian Federation. I don't see value for the other countries. I certainly don't know my geography well enough to identify all the other countries!
When I view my 2 maps, I see the html hover-text over each country.
I'm using Google Chrome -- which browser are you using?
Also, sometimes if a browser has been running for many days, it gets in an 'odd' state, and you might need to kill it and start a new browser.
Rob,
Thanks for the explanation. I learned a few new things today thanks to your blog. Keep it coming!
Rob,
Very nice improvements to the original map. I'm not very versed in working with kml files and was wondering if you could explain (or point me to some resources) what exactly the data anno_flares code is doing. I'm rather perplexed by the four consecutive input whole_line $ 1-500; lines.
Thanks,
Hi Brian,
Thanks for the comment!
When I read this particular kml file, I just treat it as text, and parse out the pieces I want. But since the data for each one is spread out over several lines, I have to get a little tricky...
First I look for a line with 'Rank' in it, and parse out the rank. Then once I find that rank line, I 'input' 3 more whole lines (which I don't do anything with), and then I input a 4th line and parse the lat & long out of it, and then input a 5th line and 6th line and parse the bcm out of the 6th line. There might be a more elegant way to do it, but this "brute force" method got me what I wanted, without having to learn any new stuff :)
The key thing here (and something that not many people know) is that when you're reading data from a file, you can use 'input' multiple times to read data that is spread over multiple lines.