Analytics claim this is the 20th most used word in English writing. What word, you might ask? This word. Which one? This one right here! You might think I'm trying to lead into an Abbott & Costello-style comedy routine, but I literally mean this word ... the word 'this'! As you can see, sometimes it is difficult to use words to talk about words. Therefore, in this blog I will also use graphics!
In 1965, Mark Mayzner performed a study on 20,000 English words randomly selected from a variety of written sources. Back then, he had to use punched cards, which was quite a labor intensive process.
Mayzner recently wrote Peter Norvig (director of research at Google) and suggested ... "perhaps your group at Google might be interested in using the computing power that is now available to significantly expand and produce such tables as I constructed some 50 years ago, but now using the Google Corpus Data, not the tiny 20,000 word sample that I used."
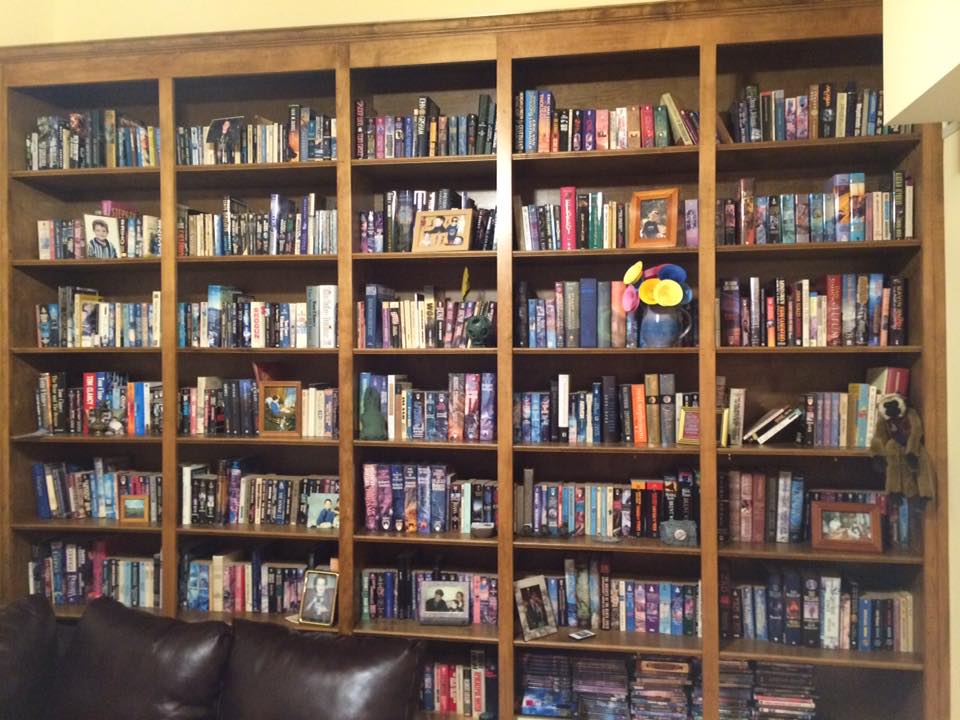
Before we get too far into the Norvig's analytics, how many is 20,000 words? How about 200,000 or 2 million? How many words would you estimate are in my friend Frank's books in this picture? Food for thought...
Norvig crunched through 23GB of the Google books Ngram word count summaries, and came up with 97,565 distinct words, which were mentioned 743,842,922,321 times. He came up with the following graph, which shows summary counts of the 50 most frequently used words:
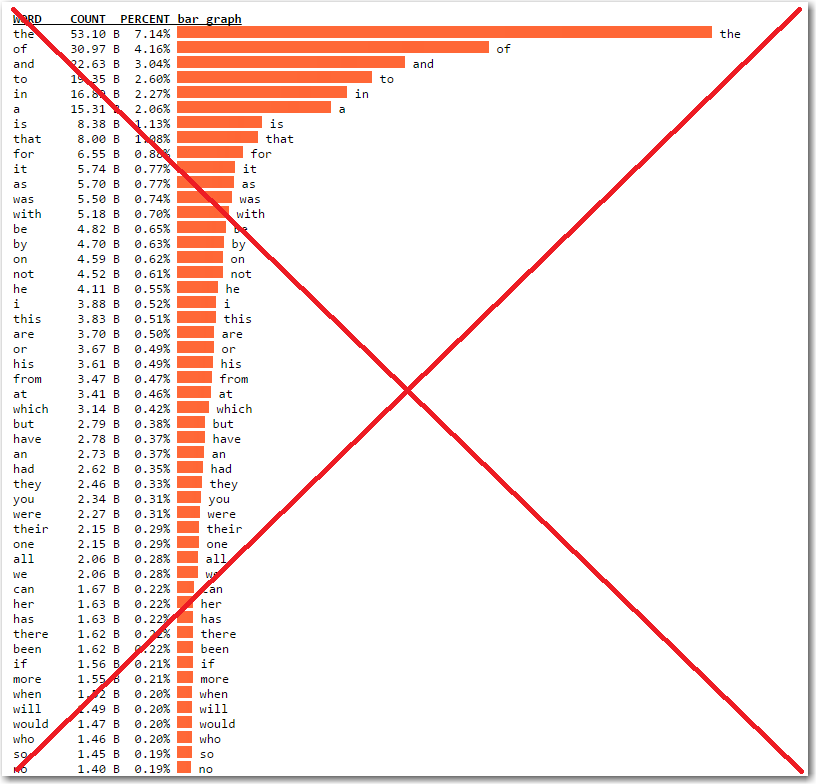
It was an interesting graph, with several nice features ... but I found it took me quite a while to fully understand it. For example, the % values showed the percent of all the word counts, not just the percent of these top 50. It also took me a while to figure out that the column of 'B's signified that the values were in billions (all these 'B's seemed a bit confusing, and consumed a lot of space). Also, the words on the left were left-justified, which put them far enough away from the columns of data that it was sometimes slow/difficult to determine which row they matched up with (I prefer to make the text right-justified in horizontal bar charts).
Can you look at Norvig's graph (above) and quickly determine which is the 20th most used word? Not very easily ...
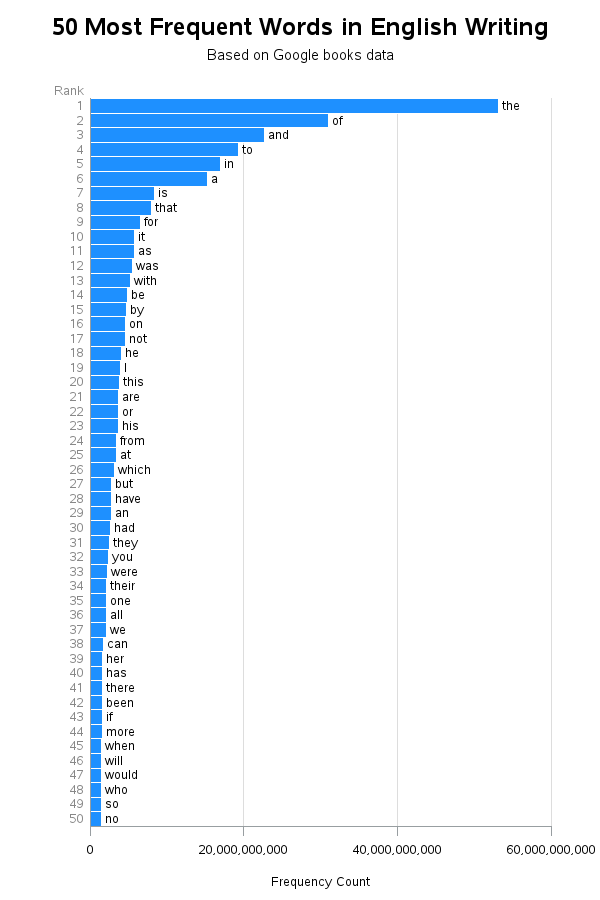
Of course, it's poor form to complain about a graph, if you're not going to show how you'd do it differently. Therefore I found Norvig's data, imported it into SAS, and came up with the following simplified chart.
In my graph, I clearly identified what the chart represents in the title, and I only show the rank and the word, rather than the actual frequency count and the percent value (simplify, simplify). It's not quite as 'sexy' as Norvig's graph, but I think you can see the important things much more quickly - for example, it is very easy to determine 'this' is the 20th most frequently used word.
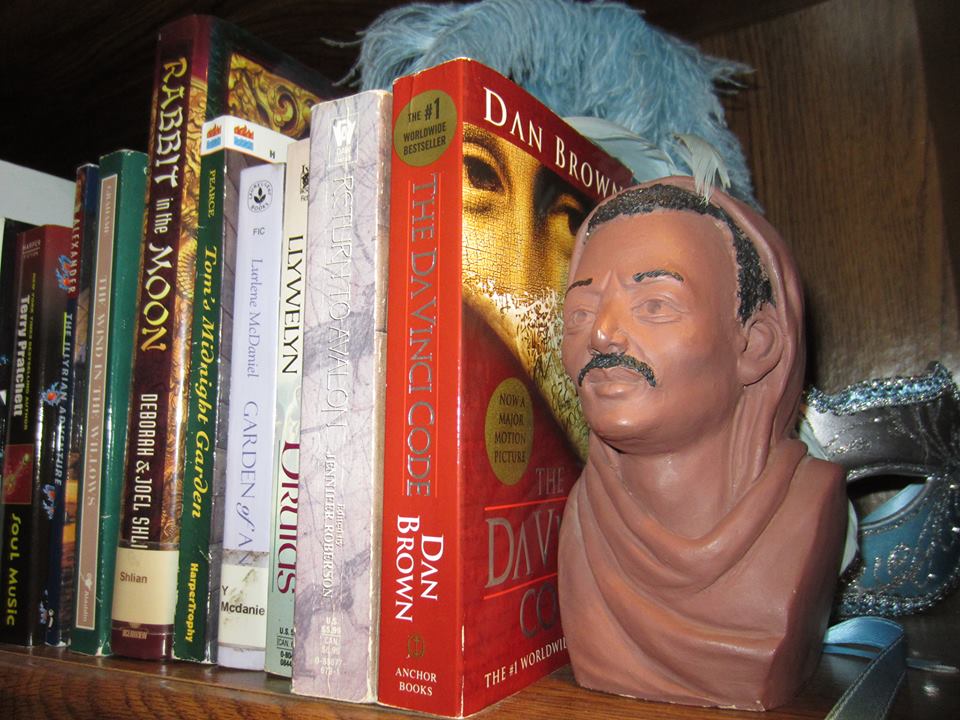
Wouldn't it be interesting to be able to get a word-count graph of the books in each person's bookshelf? I'll leave you with a couple more "bookshelf photos" provided by two friends of mine (Hannah & Kara).


4 Comments
Pingback: Using more of the 1,000,000+ English words
Mayzner and Norvig did much more than look at word frequency. They analyzed the relative frequencies if one-letter, two-letter, three-letter,... sets of letters.
I've written about the frequencies of singles letters in an English corpus, and also about the frequency of two-letter combinations (bigrams). (Dr. Mayzner posted a comment on the second post.) These frequencies are important for the statistical cryptographic analysis of cipher.
Hi Rob,
Nice article. I have been trying to produce a similar table with SAS, but I don't seem to find a SAS procedure for doing this. I know the Proc Freq would do if every word in the variable is stored in a row.
Thank You
You're wanting to produce a bar chart with tabular information beside of it?
Here's an example that shows one way to do that:
http://robslink.com/SAS/democd42/bar_table_info.htm