July has been an exciting month for me. Not only because of the historic Tour de France this year... but even more because this month the new offering SAS Factory Miner was officially released!
With SAS Factory Miner you can run predictive models in an automated model tournament environment to quickly identify the best performer for each segment. Wait a second… tournament, best performer, segment… doesn’t that sound like the Tour de France? Maybe it’s not such a coincidence after all that the launch of SAS Factory is during the world most prestigious cycling race. Let’s investigate how they relate.
Not one, but multiple winners
As organizations begin to apply analytics to growing numbers of customer and business segments, predictive models often must be developed at increasingly granular levels. SAS Factory Miner provides an environment for building, comparing and retraining predictive models at scale across multiple segments. With just a few clicks you can uncover the champion model for each segment.
In the Tour de France there are different competitions to draw riders of all specialties: time, points, mountains, and a classification for young riders. The leader of each classification wears a distinctive jersey: The yellow jersey represents the race leader, the green jersey represents the race's best sprinter, the polka dot jersey designates the race's finest climber and the white jersey designates the highest-ranked rider in the overall competition age 25 or younger.
Fine-tune to improve
If your models are underperforming in a specific segment, it’s easy to manually fine-tune these models to improve the accuracy of your predictions. SAS Factory Miner is a so called ‘white box’ solution because a log file is being generated for every model. So you run on autopilot when appropriate and take control when needed.
This is similar to the Tour de France: each team is followed around the course by a support car, from which a sporting director can give instructions over the radio, refresh water and supplies, and give mechanical help and replacement bikes during the race. Riders can also get mechanical help from a neutral service car in the event of a puncture or other failure, and treatment from the medical car.
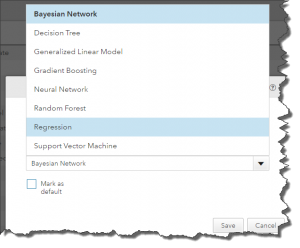
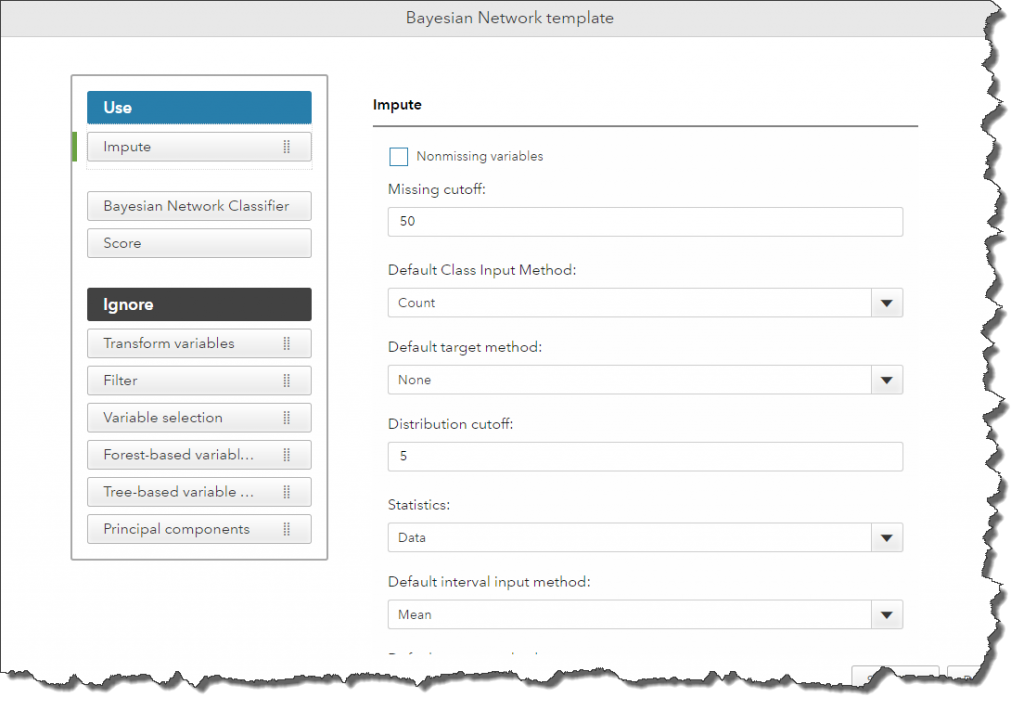
SAS Factory Miner provides easy-to-use model building templates that take advantages of cutting-edge machine-learning techniques such as random forests, gradient boosting, support vector machines and Bayesian networks, as well as decision trees and regression models.
Every year, innovative new bikes and products are launched at the Tour de France. From new shades and brakes to aero and light bikes, riders are spoiled with the latest technology.
A variety of models
For every factory project, you can choose which modeling templates you want to compete in the tournament – selecting from default templates, your own templates or those shared by your colleagues.
One great appeal of the Tour de France is its flexibility. Organizers arrange the course as they choose, but always with a plan to include a balance of most of the different types of races or all of them: Flat and rolling stages, Mountain stages, Individual time trials and Team time trials.
Reports/Ranking
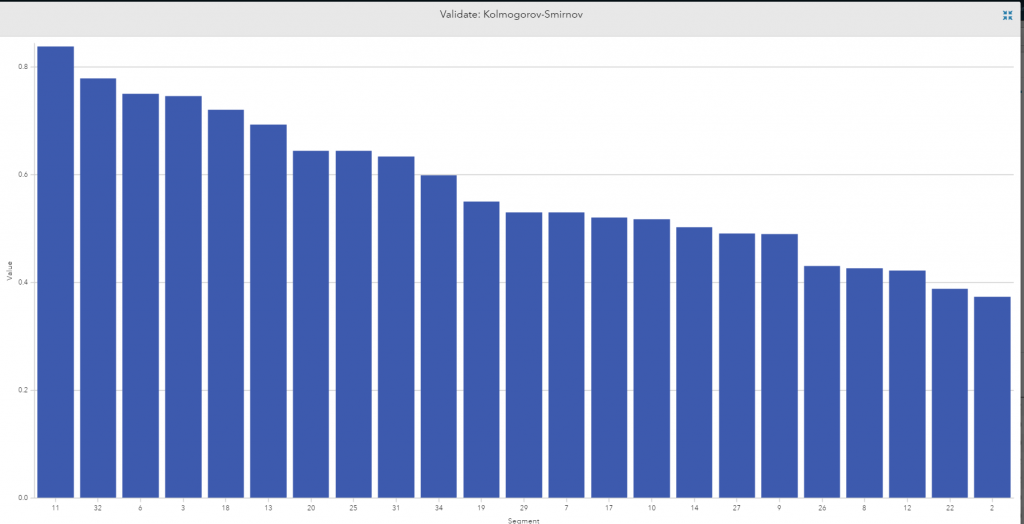
SAS Factory Miner generates summary reports that contain model results, significant variables and model settings. Modeling results allow you to look at results across segments as well as compare models within segments.
After each leg of the Tour de France, detailed classification lists are available with rankings, times, averages -- so the spectators are informed at a maximum.
Override champions
SAS Factory Miner automatically selects the champion model for each segment using customizable assessment techniques but you have the ability to override system selected models and manually identify the champion model using your favorite criteria.
If a winner of the Tour de France broke one of the rules, he loses his victory and gets disqualified so justice will be served.



3 Comments
Great great analogy to help someone like me understand this technical subject! More of this please! And yes, I love the idea of predictive analytics for next years winner.
Thanks Susan! Great idea for next year, stay tuned :)
Love the Tour de France references! I'm a big Tour fan and I spent nearly the entire month glued to the television (when I wasn't working of course). Maybe next year SAS can use some of the Tour's historic data to predict the winner.