Update: This blog has been updated with the 2016 map.
You can use SAS for just about anything - that includes finding a great fireworks show to watch during the US Independence Day holiday!
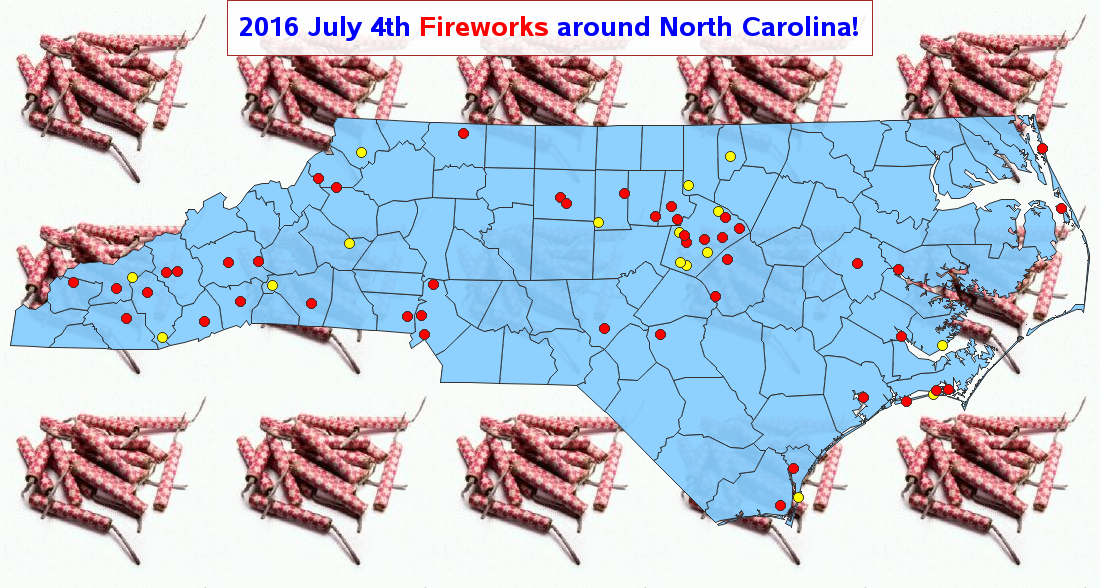
Here's a fireworks-locator map I created using SAS (see technical details below). The red dots represent fireworks shows on July 4th, and the yellow dots represent ones that are on a different night (mostly July 3rd). If you're in North Carolina for the holiday, hopefully this map will help you find some great fireworks near you. And if you're not in NC, then maybe this map will inspire you to create a similar map for your own state!
This example is a little flashier than my usual business, scientific, or news graphs ... but it's designed for a different audience. It's just a fun map! And although you generally wouldn't use all of these tricks together in the same graph, it's a good example showing how to use these features, should a special need arise. Here's a link to the SAS code if you'd like to experiment with it.
Technical Details:
In my data, I have the zip code of the location with the fireworks, and I use Proc Geocode to estimate the latitude/longitude center of each zip code. Rather than using the traditional (old) maps.uscounty, I use the newer mapsgfk.us_counties map - this allows me to leave all my latitude/longitude data in eastlong degrees (whereas the traditional old maps required me to convert the latitude/longitude to westlong radians). I use annotate to place the red and yellow markers at the lat/long locations, and I add descriptive html mouse-over text to each marker, using the html= variable in the annotate dataset.
I use the goptions iback option to place the firecracker image in the background behind the map, and I use an alpha transparent color for the map, so you can barely see the firecrackers behind the map. I place a box around the title (using the title statement's box=1 option), and fill the box with a transparent color (similar to the map).
For those who would rather see a text list (such as someone wanting to do a string search for a particular city name), I follow the map with a Proc Print table. I encode html href (drilldown) tags in the table so you can click on the events and launch the same Google search as the map markers, and I modify the individual style elements of the pieces of the table to do things like make the font larger, and the borders disappear.
Hopefully you'll leave the fireworks shows to the professionals, but if you decide to shoot off your own fireworks, be sure to read my previous blog post about fireworks safety - and have a safe & fun holiday!

3 Comments
Pingback: July 4th Fireworks Safety - SAS Learning Post
Great post Rob. I like how you outlined the technical detail describing how you achieved the map with links to the doco - very useful.
The best fireworks show I've been to is the 1999 to 2000 New Years Eve fireworks at Circular Quay, Sydney watching them off the Sydney Harbour Bridge.
I especially try to include links to the documentation, when it's newer or lesser-known features! :)