What is it that people like so much about motorcycles? The thrill/excitement/freedom of riding them, the 'biker image' portrayed in movies, or great songs such as Little Honda by the Hondells? I'm not a biker per say, but I do have a couple of motorcycles, and am a known associate of some bikers. Therefore when I saw a graph of some biker data, it caught my attention and I had to try my hand at improving it.
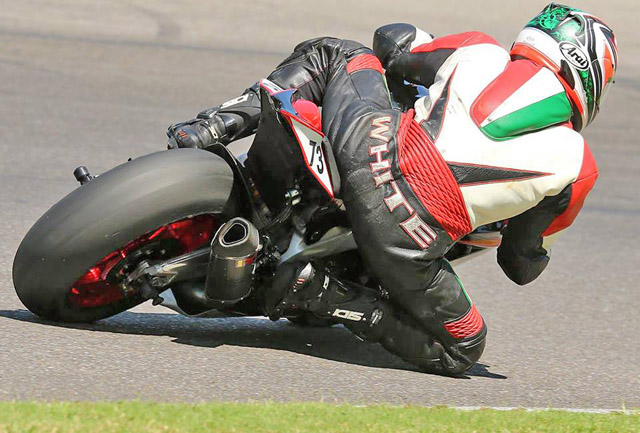
But first, here's a picture of one of my biker buddies here at SAS, Mark - he's got several bikes, and especially likes to ride on race tracks. The graphs below have a '>=50' age category, and you probably would have never guessed that Mark has been in that category for many years! :)
And now, let's proceed with the data analysis!
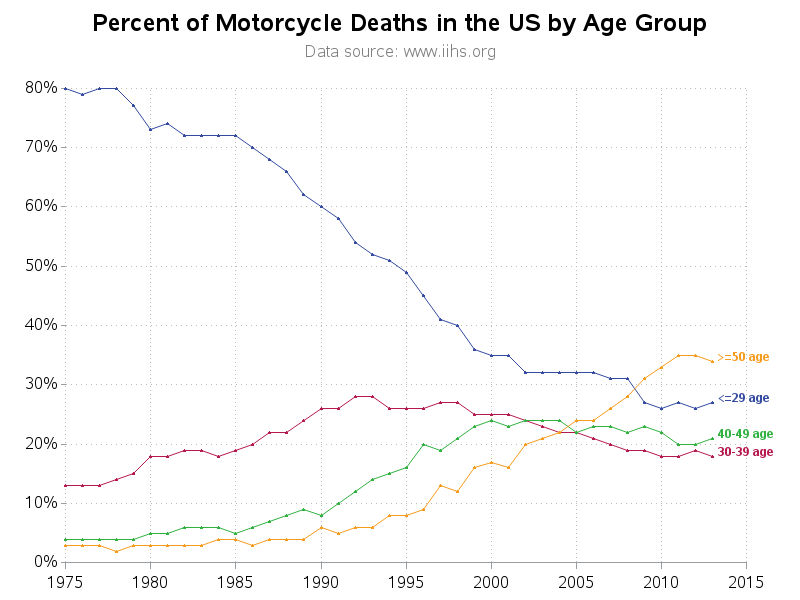
I recently saw a very interesting graph on dadaviz.com showing motorcycle deaths by age category. The feature about the graph that jumps out at you is that the percent of deaths for the <=29 age group seems to have gone down significantly since 1975. So, of course, I found the data, and created my own version of the graph using SAS:
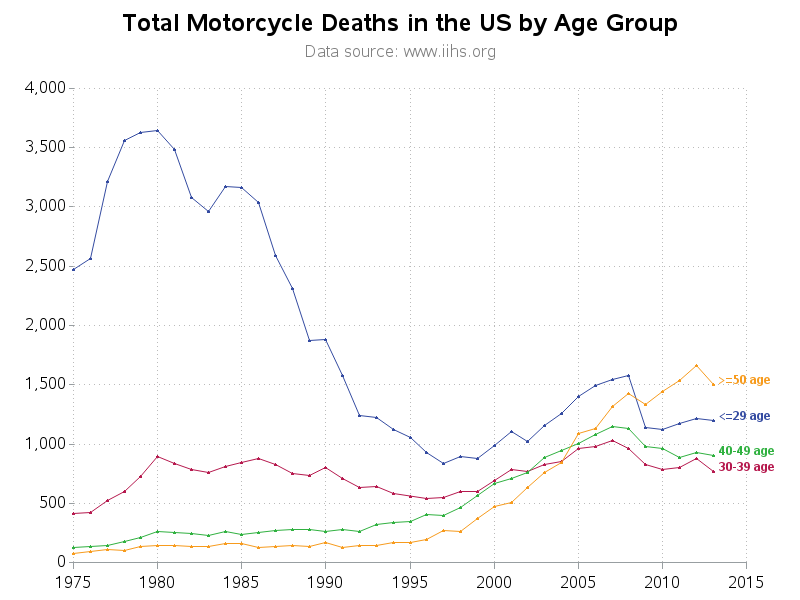
The data also had the total number of deaths per age category, so I plotted that too. And from this plot, it looks like the number of deaths has generally been on the increase since year 2000.
But both of the above plots have a serious weakness - they don't take into consideration the number of riders (or bikes) in each age category. And that particular data (by age category) seems a bit harder to come by, so I decided to work with the data that is easily available, and see if I could shed some more light on these numbers.
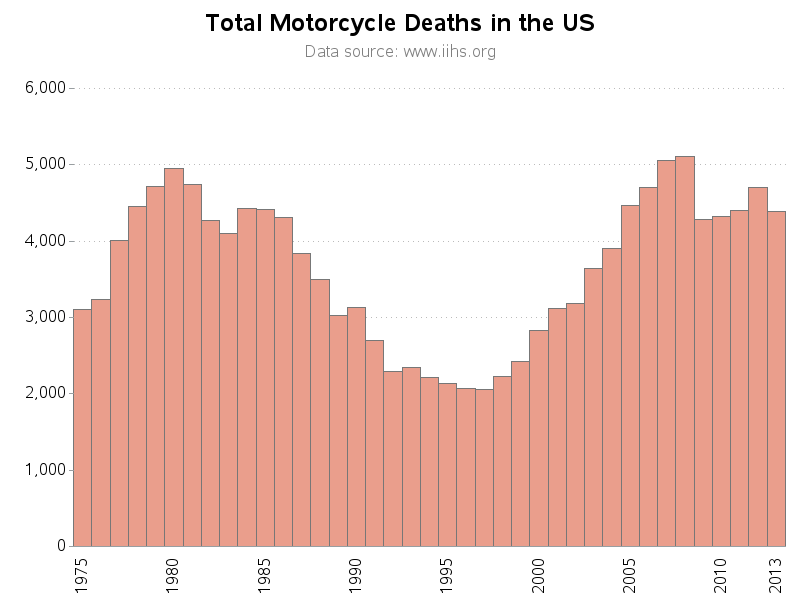
First I added up the deaths from all age groups, and plotted the total deaths per year:
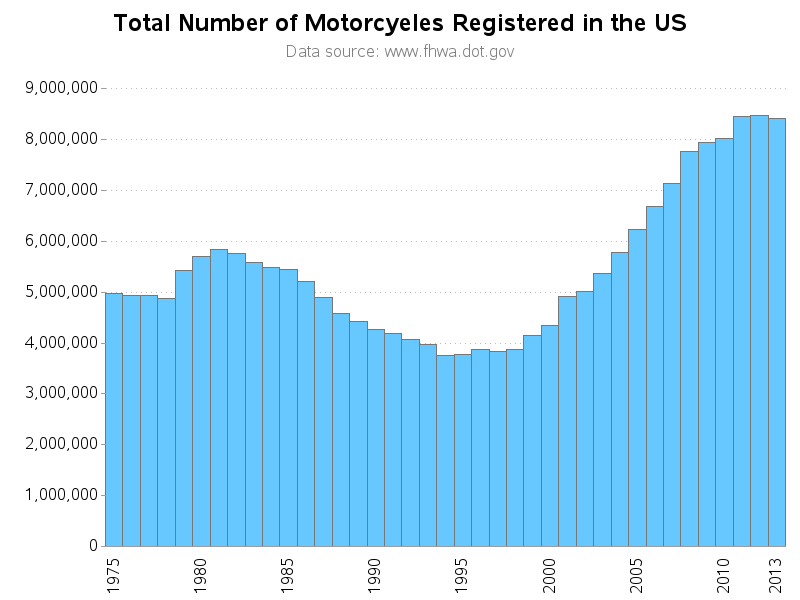
I then found a data source for the total number of motorcycles registered per year, and plotted that. Notice that the number of motorcycles has been climbing since year 2000:
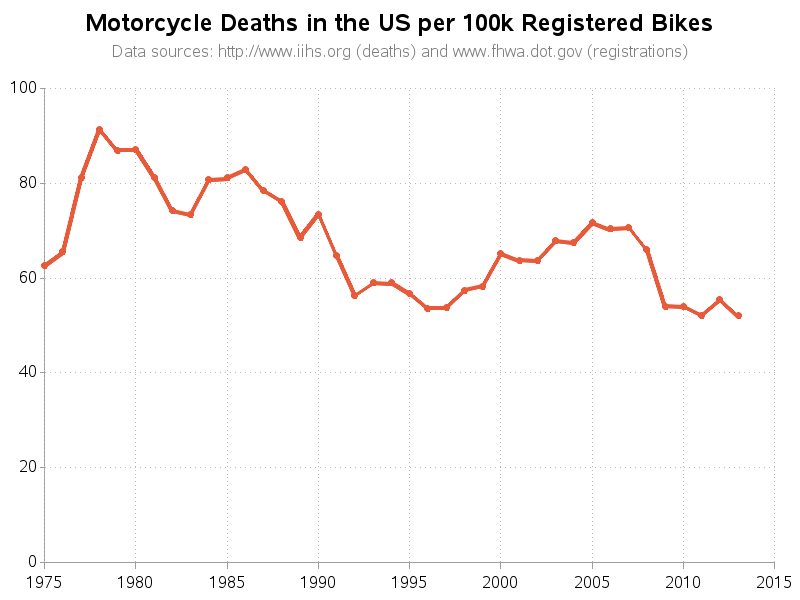
And finally, I used Proc Sql to combine the data from the previous two charts, and calculated the number of deaths per 100,000 registered motorcycles.
proc sql noprint; create table combined as select unique deaths_by_age.year, deaths_by_age.total as total_deaths, registration_data.total as total_registrations from deaths_by_age left join registration_data on deaths_by_age.year=registration_data.year; quit; run; data combined; set combined; deaths_per_100k_bikes = total_deaths / (total_registrations/100000); run; |
And this number has been generally going down over time, which is good news, and is a better/more-true representation of what's actually happening, IMHO.
Hopefully you enjoyed this little demonstration of the power of combining data!


18 Comments
The data source link to the "Total Number of Motorcycles Registered in the U.S." graph is linked to a pdf with data ranging from 1990-95. Were the remaining years pulled from the individual Highway Statistics Publications?
For the other years (1996 and up) I had to get the data one year at a time from the following reports:
http://www.fhwa.dot.gov/ohim/1996/section2.html
http://www.fhwa.dot.gov/ohim/hs97/mvpage.htm
http://www.fhwa.dot.gov/ohim/hs98/mvpage.htm
http://www.fhwa.dot.gov/ohim/hs99/mvpage.htm
http://www.fhwa.dot.gov/ohim/hs00/mv.htm
http://www.fhwa.dot.gov/ohim/hs01/mv.htm
http://www.fhwa.dot.gov/policy/ohim/hs02/pdf/mv1.pdf
http://www.fhwa.dot.gov/policy/ohim/hs03/pdf/mv1.pdf
http://www.fhwa.dot.gov/policy/ohim/hs04/pdf/mv1.pdf
http://www.fhwa.dot.gov/policy/ohim/hs05/pdf/mv1.pdf
http://www.fhwa.dot.gov/policy/ohim/hs06/pdf/mv1.pdf
http://www.fhwa.dot.gov/policyinformation/statistics/2007/mv1.cfm
http://www.fhwa.dot.gov/policyinformation/statistics/2008/mv1.cfm
http://www.fhwa.dot.gov/policyinformation/statistics/2009/mv1.cfm
http://www.fhwa.dot.gov/policyinformation/statistics/2010/mv1.cfm
http://www.fhwa.dot.gov/policyinformation/statistics/2011/mv1.cfm
http://www.fhwa.dot.gov/policyinformation/statistics/2012/mv1.cfm
http://www.fhwa.dot.gov/policyinformation/statistics/2013/mv1.cfm
I don't know when they began, but required rider-safety courses to get motorcycle stamp must be a big contributor to drop after mid-1980s.
I initially rode in early 1970s - and could easily have been a statistic then.
More luck than skill in several instances kept me off the chart.
Family responsibilities precluded such individual recreation until I got another bike in 2005.
Our state STARS program explained several techniques that I accidentally found in the early bike adventures.
I don't think North Carolina requires a motorcycle training course, but I took one (at a community college), and it was *very* helpful and informative.
Congratulations - you're smarter than I am.
If it hadn't been required, I probably would have said "I rode before, I don't need no steenking education". Definitely not true.
Additionally - in 1970s Idaho had a helmet law, so I got used to using it - and a couple of times needing it.
That law was repealed sometime between 1970s & 2000s.
My neighbor & riding buddy would occasionally helmet-up. 2 weeks ago he was run-over from behind by a couple of drag racing 20-yr olds. He had a helmet on. My buddy is recovering from road rash & TBI (traumatic brain injury); without the helmet it would have been FBI (fatal ...).
He swears by helmet now.
I think I found why the last chart has peaks in 1975 - 1985 and then in 2005. It could be related to gas prices. See this image and note where gas prices start to go up:
http://switchboard.nrdc.org/blogs/mbaumhefner/assets_c/2012/11/History%20and%20Forecast-thumb-500x341-8760.jpg
People may have been buying motorcycles who have never owned them before just to save money at the gas pump.
Yep - especially if 50cc scooters are included in the fatalities data (and they might not be included in the registration data, since many states don't require them to be registered). Man, it's hard to get "good data"! :)
That last chart really tells the truth since it's combined data. I can't think of "what ifs" to disprove that chart. Thank you for putting this together Robert!
Any theories of why the 50 and over crowd line is rising in the first chart? It think it's because there are more 50 and over riders than other age groups right now. These are the guys who used to ride dirt bikes in the 70s and are returning to riding today.
I don't have data, but I have theories! :)
I think maybe the Baby Boomers are getting to the age where they have the disposable income to "buy that bike they always wanted". Some might have had previous experience, but many probably didn't. And some of these older 'rich' guys probably bought the fancy custom "choppers" that were all the rage in the 2000s - and these bikes were probably made more for looking good, rather than being easy/safe to ride.
You may be right. See the "Fatally injured motorcycle drivers by age and motorcycle type, 2013" chart in the IIHS page. Fatality injured older guys with cruiser and touring bikes were a greater percentage than even the younger guys with the sport and supersport bikes. Or, maybe that's because the cruiser and touring bikes are what the old guys ride ;-)
Another possible factor - we're living longer, and therefore may be riding longer. I've seen stats that trikes are hot sellers the past 5-10 years due to older riders who don't feel comfortable handling the weight of their 2-wheelers. And the Can-Am may be bringing in new riders with little to no experience.
I am curious about the decline in fatalities for the =50 group. One speculation is that there are fewer young people with the resources to buy motorcycles, whereas us older baby boomers are either starting to ride or getting back to riding.
As for me, I have always ridden at the worst times. I rode from 1974 (age 18) until 1986 (age 30), raised my children, and got back to it in 2013 (age 57). So basically I hit the peak times for both age groups. :-(
Perhaps the >50 age group has already had a bit of "natural selection" (assuming older riders also rode when they were younger). And the ones who were not good riders either stopped riding, or perhaps died riding(?)
What jumps out at me in the first plot is that people born between 1945-1950 seem to have higher death rates than their successors over time. Worse skills? More drinking/riding? Worse bikes? Worse safety equipment? These are my questions.
Make that 1950-55, in general. And it occurs to me that these are baby boomers, and their numbers are just greater. More bikes on the road, more deaths, although as you show, fewer per bikes on the road over time.
Also - since the advent of SUV's, instead of flying over the hood of cars riders are impacting the vehicles and are more likely to sustain severe injuries or death. And since most gas tanks are designed with sharper curves, motocyclists are more likely to sustain a brain injury (probably death) when the sudden stop at the base of the seat/tank and the resulting g-forces causes the brain to rapidly bounce against the front of the cranium.
Very interesting graphs! Well done, Robert!
Thanks Mark! (... *the* Mark, by the way!)