What cities have the most and least profitable public transportation services in the US? Perhaps you can find out in this graphical visualization of the data!
The US data I'm analyzing here covers things like buses, vans, and rail ... but it might be even more interesting to analyze data from other countries, where they have a bit more variety in their modes of transportation. Can anyone guess what country my friends Joy and Erik are in?
And now, back to the US data!...
I found the data on the National Transit Data page, maintained by the Federal Transit Administration. The tables are in Excel spreadsheet format, so I had to import them into SAS, and then perform some SQL table joins to wrangle them into just the right form to plot.
![]()
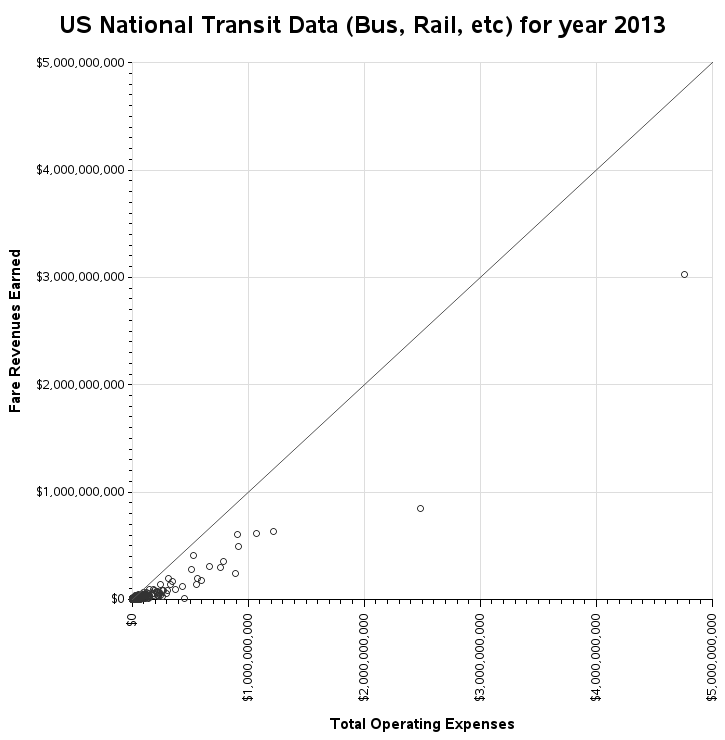
Several variables are tracked in the data, but I decided to focus on the total operating expenses, and the fare revenues earned. I used a scatter plot with a marker for each individual type of transportation in each city or county (for example NC's "Rowan Transit Systems (RTS), Demand Response - Purchased Transportation"). And I annotated a diagonal line - markers above the line are 'profitable' (in the sense that the fares were higher than the expenses) and those below it lost money.
My first plot was a bit disappointing. Since a few of the really large cities (such as NYC) had such higher values than all the others, most of the markers were squished into the bottom left corner of the graph:
So I changed to a log-based scale for my axes, which helped a lot:
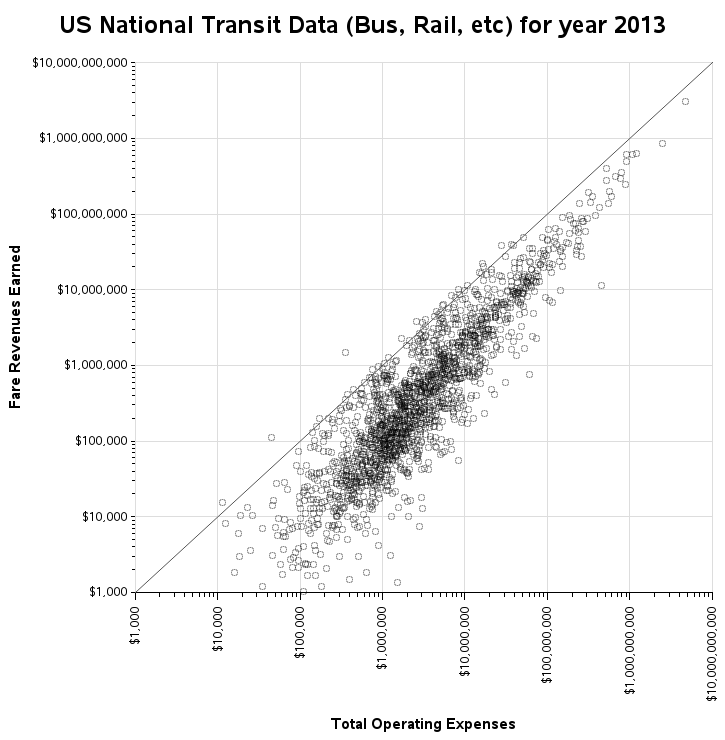
This graph lets me see the overall trend of the data, but I assumed that most people would want to see something a little more specific - like "How did my state do?" So I set up a graph for each state, where that state's markers are red, and all the other markers are light gray. And the red markers have hover-text so you can see the name and exact values. Click the North Carolina graph image below to see the interactive graphs for all the states:
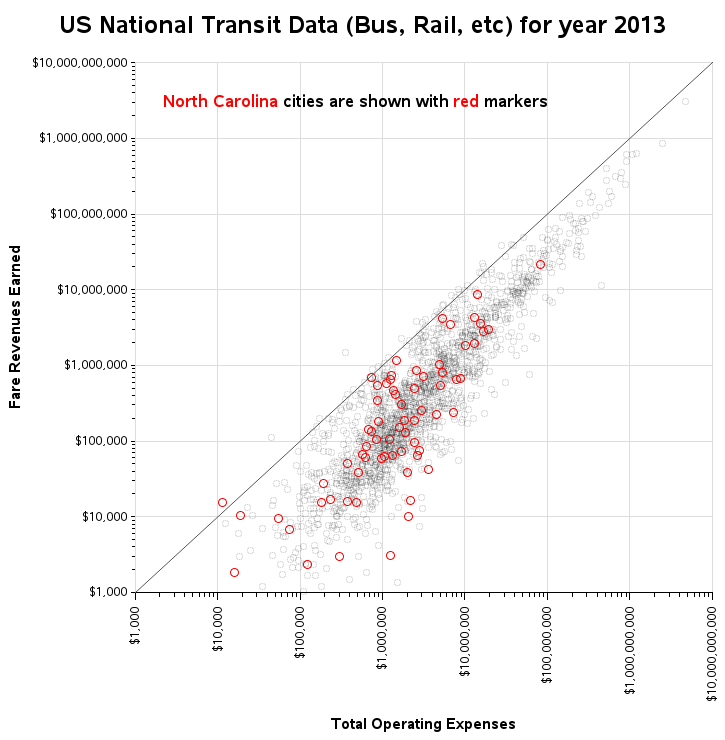
It appears North Carolina has a big variety. We had one of the few profitable markers above the line (a Vanpool in Wilmington), and one of the markers farthest below the diagonal line (some Demand Response transportation in Rowan county).
So, how did your state do? Or, if you're from another country, do you think your country's transit systems are more, or less, profitable?

7 Comments
Joy and Erik were in Thailand.
I think the cost of all public transportations need to be transparent. Please add the cost of roads and their revenue sources to the graphs. I really don't know if any of these "pay for themselves". I think Al's point is sometimes missed by writers implying the cost of all transportation systems must be cover their expense.
Mike - the cost of roads would be a very difficult number to come up with! :)
Are city buses supppose to make a profit ? Do you mean more money for the owners ? Social or community profit ? How about breaking even ?
My impression is that as part of the infastructure supporting our economy, they add material value to it by assuring that we get to and from work. Of course, I'm assuming that the passengers add value to our economy... or even when using public transportation for lesiure.
Maybe the question should be rephrased in terms of efficiency and productivity. Why? bcause if they don't add value, then they are not of much use. And if they are not efficient, then they are removing potential value.
This is actually an optimization problem with many constraints. The immediacy of 'profit' can become a distraction when viewed narrowly.
I like the way you think, Al! :)
Yes, there are many additional factors to consider (some we might could put a $ amount to, and some where that would be difficult). For example, when people ride public transport it frees up parking spaces in crowded downtowns. Also, public transportation might give low-income people (who can't afford a car) a way to get to work ... which helps out their employer, and the customers they are serving.
But, with the data available in this particular dataset, I like your proposal to think of it as a comparison of efficiency, rather than profits.
I live in Carrboro, and there is no fare for our bus system: Chapel Hill Transit (CHT). A very good deal, at the rider level at least! The Towns of Chapel Hill and Carrboro, and UNC at Chapel Hill all share the costs, so I am paying some amount for it with property and sales taxes. Robert's (very nicely done) graph for NC shows CHT's Profit per Passenger Trip as $-0.79. I ride frequently, so it still seems like a good deal to me! ;)
My daughter takes the Raleigh city bus to school every day. They just raised the fare a little bit for adult passengers, but added a special student rate. So her cost went down from $1/day to $0.60. A pretty good deal.