Is this blog post about techniques to use on difficult graph legends, or is it about goats? The answer is both!
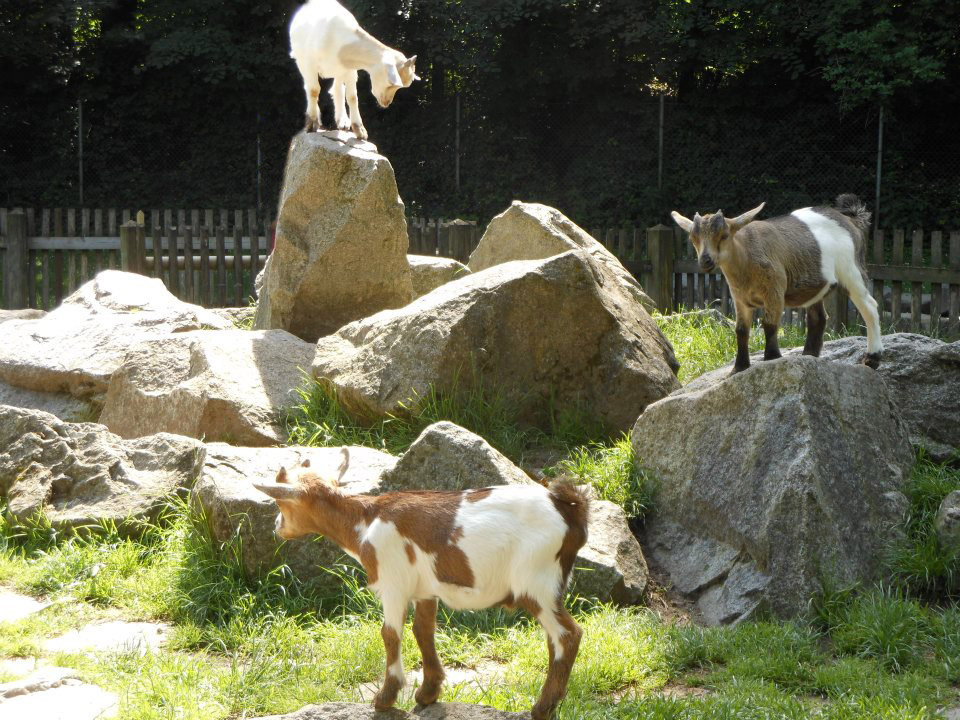
But first, to get you into the proper mood, here is a picture my friend, Mark, took of some cute goats. And some links to YouTube videos about goats standing on things, and balancing on a fun/wobbly roof.
OK - now for the technical part of the blog!
My friend Julianna recently forwarded me an interesting article from the Washington Post about goats in the U.S. Apparently there are over 2.5 million goats (who knew?!?), and the article had a map showing where all these goats are located.
Their map was pretty good, but I wanted to see if I could create an improved version using SAS. I tracked down the data on the USDA National Agricultural Statistics Service website, and set up a query to download the data in CSV format. I imported the data into SAS using Proc Import, and then started graphing.
The main thing I wanted to change was the legend. Theirs had 7 shades/colors in it, and I generally try to go with 5 (or fewer) colors. I sorted the data and looked through the values, and saw very few values in the ~5 range, and none that were specifically zero. Basically, I decided to combine their lower ranges, and set the top range to 5000+ (rather than 10,000). Also, certain counties with a low number of goat-owners had their value listed as '(D)' rather than the actual number of goats, and I wanted to also be able to represent that as a different color in the legend. Here's a screen-capture of their legend:
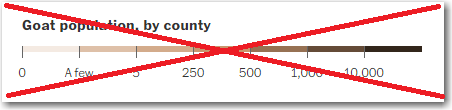
Therefore I used a data step to categorize the values into 6 'buckets' (sorry if the less-than symbols don't appear correctly in the blog - here's a link to the actual SAS code!):
data goat_data; set goat_data; if value='(D)' then bucket=1; else if goats <= 250 then bucket=2; else if goats <= 500 then bucket=3; else if goats <= 1000 then bucket=4; else if goats <= 5000 then bucket=5; else if goats > 5000 then bucket=6; run; |
And I created a user-defined-format to have those 1-6 bucket values print in the legend as the desired text:
proc format; value ranges 1 = 'non-disclosed' 2 = '<=250' 3 = '<=500' 4 = '<=1,000' 5 = '<=5,000' 6 = '>5,000' ; run; |
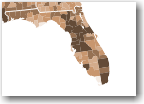
One other small improvement ... Their map used white to outline the states, but when there was a light/white county on the edge of the map, the white state outline tended to make that county visually 'disappear'. For example, the county at the southern tip of Florida (see screen-capture below). I decided to use a black state outline instead.
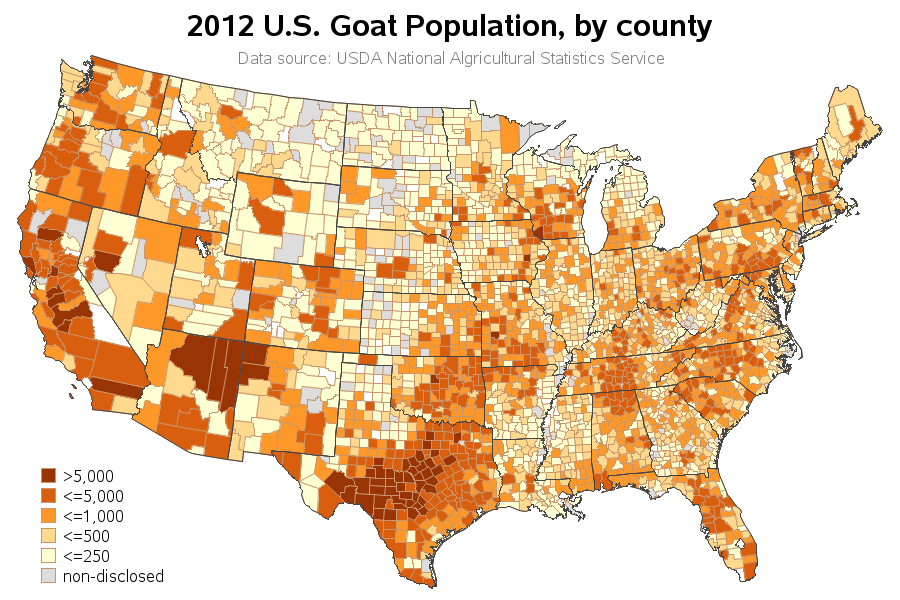
And here is my SAS map - click the image below to see the full-size version, with hover-text for each county:
So, how do you think the expression "get your goat" came to mean "make you annoyed or angry"? What graphics or data analysis problems get your goat?!?

7 Comments
Coincidentally..
http://www.bbc.com/news/magazine-30583512
Rob,
Please excuse an ODS newbie, but I am trying to use your code to re-create your map and I get an error message "Physical file does not exist, export\home\adamsb\us_goat_inventory.htm"
I've done some googling but haven't found any answers.
Thanks,
Brian
Probably best to contact SAS Tech Support on that one!
Brian, you'll probably need to replace this:
filename odsout '.';
With a path that you know your SAS session can write to. Example:
filename odsout '/u/adamsb/myfiles';
Without looking at Google, I'm guessing that goat owners became annoyed/angry when someone stole (or got) a goat from them.
Yes - that would certainly "get my goat"! :)
Amazing to discover there are so many goats in the US. The map is quick and easy to understand. Well done. I grew up on a small farm in Virginia with a few goats, and became proficient at milking Nannie. Goats do a great job clearing land of unwanted undergrowth. With so many goats in the US, I wonder how the stats would stack up for how they are used: pets, meat, milk and cheese, to clear land, etc.