SAS UK & Ire land recently ran a competition to find the region's 'top data scientist'; the competition challenge was to produce a forecast of energy demand for the UK in the year 2020 based on the data provided. Competition for this coveted award was fierce; with the winner claiming a trip to SAS Global Forum in the USA and the chance to feature their submission on the SAS Professionals Network.
I recently caught up with Dr. Mohammad Abbas to discuss how he solved the challenge.
Phil: Could you tell us a bit about your background?
 Mohammad: I hold a Master’s Degree in Organic-Geochemistry and a Ph.D. in Inorganic Chemistry. While working in the public sector as a chemical analyst in an animal health laboratory, I developed a strong interest in how statistical applications and experimental design are used in animal health. I pursued this interest by gaining a Diploma in Statistics from the Open University and I’ve since devoted considerable time experimenting with analytics using data sets drawn from various disciplines.
Phil: Why did you choose to enter this competition?
Mohammad: Well, I saw the Top Data Scientist Competition as an opportunity to test drive my skills in Big Data Analytics. Tackling a large analytical project in a predefined time scope was a worthy challenge. It offered me the opportunity to constantly re-evaluate my skills and identify ways to achieve a result.
Phil: The challenge was to forecast energy consumption in 2020, how did you go about tacking the problem?
Mohammad: Having spent some time examining the 47 or so datasets and doing some background reading on energy consumption, I was in a position to develop some approaches to tackling the problem. In essence, it consisted of three key phases: exploratory data analysis, identifying the key model parameters and then selecting a model.
Phil: An interesting approach, could you tell me a bit more about each phase?
Mohammed: Generally, exploratory data analysis is by far the most important step in any analytical process and I started by investing a significant amount of time in understanding and visualising the data. It was through this step that I was able to build data blocks and make logical connections between data objects.
 Next, I needed to identify the key model parameters. With energy data, there are a lot of variables which can be used at a later stage in the modelling process. The task at this stage was to be able to ask questions of the data and subdivide those answers into clearly defined groups. For example, what impact do economic factors have on energy consumption? How should factors such as gross domestic product, housing, population and disposable income be taken into account? How was energy 'intensity' (that is energy consumption across the domestic, industrial, transport and services sectors) calculated and presented in the data sets? What was the relationship between energy consumption in primary equivalents and final energy consumption?
Phil: What do you mean by energy consumption in primary equivalents and final energy consumption?
Mohammad: By this I mean, the difference between the amount of energy generated and the final amount consumed. Some energy is lost in the production and transmission of power; burning coal to generate electicity looses some of the coal's energy in the process and further power is lost when that electricty is transmitted via pylons, for example.
I needed to answer all of these questions and more to choose the best variables. Based upon these findings, I subdivided the key parameters into three distinct groups:
- Economic factors and related energy consumption variables
- Energy intensities by sector (domestic, industry, transport and services)
- Energy consumption in primary equivalents and final energy consumption.
Phil: OK, so how did you go about selecting the best model?
Mohammad: SAS offers a wide array of modelling procedures; and choosing which model to use depends upon a clear understanding of the analytical problem and how much you know about the various statistical modelling methods available. Of course, you also need solid diagnostic skills.
To meet the challenge, it was essential to reduce the number of variables analysed to as few as were relevant; this is known in statistical parlance as 'reducing dimensionality'. I also needed to take data quality into account and also standardisation was needed as some figures were expressed in thousands and others in millions. Also, some energy consumption data was expressed as tonnes of oil equivalents while others as Terawatt-hours so conversion of these units was needed.
Phil: How did you go about reducing the number of variables, the 'dimensionality' as it's called?
Mohammad: There are a number of ways to reduce dimensionality, one of which is a model that combines both dimensionality reduction techniques and regression models. You can use methods such as 'factor analysis' and 'principal component analysis' which can be applied individually to reduce dimensionality, or combine them with a regression model to obtain obtain a powerful unified approach known as a 'Partial Least Square Regression Model'. Of course, SAS provides the ability to do all of this.
Phil: So which fundamental questions were you trying to answer?
Mohammad: I was trying to address two key questions, Firstly, how much variation within the predictor variables (those variables which explain the values of other variables, sometimes known as independent variables) could I explain. For example, atmospheric temperature could explain energy consumption, as it gets colder, more people put on their heating and hence use more power. Secondly, how much variability in the target variables could be explained by my choice of predictor variables. In other words, my target variables concerned energy consumption in 2020, so to what extent did the predictor variables I had chosen help to explain, and hence forecast, that?
Phil: So what results came out of this process?
Mohammad: My dimensionality reduction techniques reduced the large number of variables into a handful of factors. Then the partial least square model generated what are known as factor loadings, weights and scores, which helped me to explain how much each factor contributed to the final forecast and how accurate those forecasts would be. Also, examining the various models' outputs and their associated diagnostic plots helped me to shape the final prediction process.
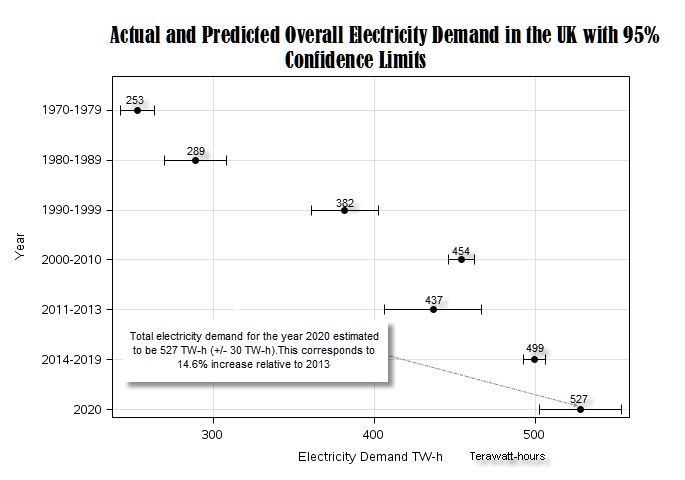 Obviously, trying to predict a single value (energy consumption in 2020) has a large amount of uncertainty associated with it. So, I ran the model a number of times using different inputs. I tried broad economic factors, electricity consumption and energy intensity (consumption) for each specific economic sector and finally I used randomisation as a means of assessing my model's ability to differentiate between irrelevant (noise) variables and those with real predictive power. This allowed me to forecast electricity consumption for the UK in 2020 with a difference of approximately 80 TW-h (terawatt hours) between the highest and the lowest predicted value.
Phil: Amazing, so what did you find out?
Mohammad: I predict that the overall demand for electricity in the UK in 2020 will be 527 (+/- 30 TW-h). This represents an increase of 14.6% relative to 2013. Given the potential growth in population, housing and usage of electrical devices in the UK in the next few years, I think this is pretty accurate.
Finally, I would like to say, I am delighted to have been named as the first winner of this competition. From my experience, the most appealing about this competition was the challenge of taming a large volume of data and to be able to draw valuable insights and relate those findings to the real world we live in. This is what Big Data Analytics is all about.
 UK firms are struggling to find the big data skills they need, click here to read new research by SAS and Tech Partnership highlighting the extent of the problem facing British businesses.


1 Comment
I think that is one of the so much significant info for me.
And i'm happy studying your article. However should
statement on some basic things, The site taste is perfect, the articles
is truly great : D. Just right job, cheers