In the last edition of the European elections, the main question was not only “Who is going to win the elections?” but also “What is going to be the turnout?” As it has taken a month and half to establish the real figure (the previous figure was based on exit polls so was preliminary) we can finally dive deeper into it.
The relationship between voter participation and party fortunes has received much attention in the voting behavior literature. Specifically, a number of studies on the advanced industrial democracies postulate that left-of-center parties benefit from higher turnout.
Turnout is seen as a critical test for European democracy, and it has fallen steadily and consistently since 1979, from 62% in the first election in 1979 to 43% in the 2009 election.The final turnout figure for this year’s European Parliament elections has been revealed as 42.54% – the lowest-ever turnout and lower than the number communicated immediately after the elections. This means that the eighth legislature of the European Parliament will not be more representative for the European population than the previous one.
In statistics we make a difference between the population and a sample. The population is the entire collection of individual members of a group of interest. When the entire population can’t be measured, we make use of a sample. A sample is a subset of a population that is drawn to enable inferences to the population. A sample should be representative of the population, meaning that the sample’s characteristics are similar to the population’s characteristics. A representative sample should be an unbiased indication of what the population is like.
Four EU countries have a compulsory voting law for the European Parliament elections; Belgium, Luxembourg, Greece and Cyprus. Theoretically the votes in these countries would reflect the entire population. While Belgium and Luxembourg show a turnout of above 85%, the figure is still low in the two other countries (57% in Greece and 42% in Cyprus).
Will the eighth legislature of the European Parliament be representative for the entire population? This is a question that we can’t answer, however statistics allow us to calculate if there is an association between the turnout in the different member states and the outcomes of the elections.
A commonly used test that examines whether there is an association between two categorical variables is the Pearson chi-square test. According to this method an association exists between two categorical variables if the distribution of one variable changes when the value of the other variable changes. If there is no association, the distribution of the first variable is the same regardless of the level of the other variable. In other words, the chi-square test measures the difference between the observed cell frequencies and the cell frequencies that are expected if there is no association between the variables. If you have a significant chi-square statistic, there is strong evidence that an association exists between your variables.
In order to perform the Pearson chi-square test I combined the turnout data with the winning European party per state and I created a variable ‘Turnout category’.
| Country | Winning party | Turnout | Turnout category |
| Slovakia | EPP | 13.0% | 0-30% |
| Czech Republic | EPP | 19.5% | 0-30% |
| Poland | EPP | 23.8% | 0-30% |
| Croatia | EPP | 24.3% | 0-30% |
| Slovenia | EPP | 24.5% | 0-30% |
| Hungary | EPP | 29.2% | 0-30% |
| Latvia | EPP | 30.0% | 0-30% |
| Portugal | S&D | 34.5% | 30%-40% |
| Romania | S&D | 34.7% | 30%-40% |
| UK | EFD | 36.0% | 30%-40% |
| Estonia | ALDE | 36.4% | 30%-40% |
| Netherlands | ALDE | 37.0% | 30%-40% |
| Bulgaria | EPP | 40.2% | 40%-50% |
| Finland | ALDE | 40.9% | 40%-50% |
| Cyprus | EPP | 42.4% | 40%-50% |
| France | NI | 42.4% | 40%-50% |
| Spain | EPP | 44.7% | 40%-50% |
| Austria | EPP | 45.0% | 40%-50% |
| Lithuania | ALDE | 47.3% | 40%-50% |
| Germany | EPP | 47.9% | 40%-50% |
| Sweden | S&D | 51.0% | 50%-60% |
| Ireland | EPP | 51.2% | 50%-60% |
| Denmark | EFD | 55.0% | 50%-60% |
| Italy | S&D | 57.2% | 50%-60% |
| Greece | GUE/NGL | 57.4% | 50%-60% |
| Malta | EPP | 74.8% | 60%-100% |
| Luxembourg | EPP | 85.5% | 60%-100% |
| Belgium | G/EFA | 90.0% | 60%-100% |
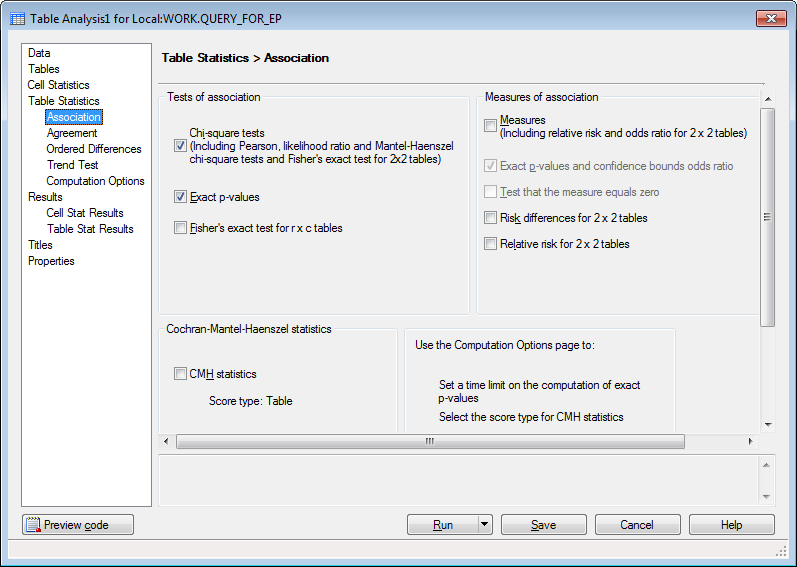
Next step was to turn this table into a crosstab. Therefore I used the Table Analysis task in SAS Enterprise Guide. Within the Table Analysis task the Chi-Square tests can be calculated.
If we look at the rows of the crosstab below we see that European People’s Party (EPP) is the most popular party in 15 of the 28 European countries. If we look at the columns of the crosstab we conclude that in all 7 countries with a turnout between 0 and 30% European People’s Party was elected. This was not the case in any of the 5 countries with a turnout between 30% and 40%. This is an illustration of the fact that there is an association between the turnout and the winning party.This conclusion is confirmed by the Pearson chi-square as the outcome of the test was significant (χ2=38.09 and Exact P=0.013).
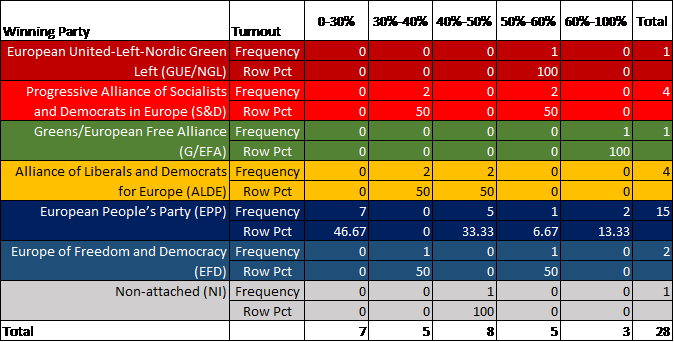
Based on this we could presume that a right party benefits from the lowest turnout but keep in mind that an association does not necessarily imply causation!