I'm sure that anyone in the world would do whatever they could to help find the missing Flight 370 ... and this is my attempt to do what I can.
In my previous blog post, I showed how SAS could be used to visualize the locations where planes have disappeared. This blog takes it a step further, and shows how the specific data used in the search for missing Flight 370 could be analyzed by SAS and plotted on a map, all in a data-driven way.
I don't have the actual data, so I have estimated it by looking at various maps in the news for this proof-of-concept. The code is all data-driven, based on latitude/longitude coordinates, therefore it would easily be re-run with the real data. If you're a SAS user out there helping with this search, I'll be happy to provide you with the code!
Here is a snapshot of my map - you can click on it to see the interactive version with hover-text and drill down capability. Following the map, I explain what SAS techniques I used to create the map:
![]()
I create my base map by starting with the world map that ships with SAS/GRAPH, and projecting it using a cylindrical projection, and then clip out just the area of interest. I add hover-text to each country, so you can hover you mouse over them to see the country names. I then use annotate to overlay a grid of dashed lines representing the latitudes and longitudes, and add a label to the end of each grid line.
For the 'data' part of the map, I start with the known data. I plot a marker at the locations of the airport where the plane took off, and where it was supposed to land. I add hover-text with the airport names, and you can click them to drill down and see a Google satellite map of the airports. Similarly, I draw a blue line following the known path that the airplane took, and plot a marker at the last known location. I add hover-text and when you click on that marker it drills down to a diagram showing details about the known portion of the flight.
I then plot the location of the Inmarsat satellite in geosynchronous orbit above longitude 64-East, which collected the final 'ping' data from the plane. I used character '6b'x of the Webdings font for the satellite image, and add hover-text and drill down to a page with more information about the satellite. I draw a line from the satellite to the last known location of the plane, and then symmetrical arcs showing the possible location of the plane when it made its final ping.
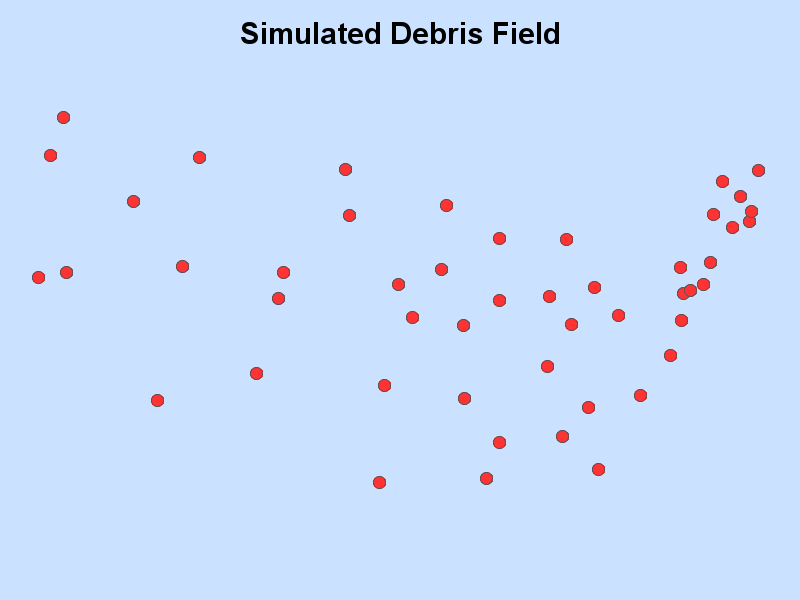
Next I plot data about the unknowns. I plot some possible flight paths, using latitude/longitude coordinates along the path, and add a marker with hover-text at the end of each path. I use the annotate poly/polycont function to draw the polygons for the possible debris fields. I use alpha-transparent color for these, so they will not obscure any map details that might be below them. I add hover-text with some information about the debris fields, and when you click on them you see a visualization of the pieces of debris (remember that this is just a proof-of-concept, and I don't have the coordinates of real debris!) Here's an image of my simulated debris field:
In addition to visualizing the debris, we could also use SAS to analyze it in various ways. For example, we could calculate the "optimal tour" to visit all the pieces of debris using the TSP statement in SAS/OR's Proc OptNet, as described in one of my previous blog posts. This would hypothetically tell us what order to visit all the pieces of debris, while traveling the shortest distance (which would hopefully also be the shortest time).

Now it's your turn - perhaps you can think of something in your area of expertise where SAS software could be used to help analyze the data. If you have an idea you'd like to share, feel free to leave it in a comment!


5 Comments
That simulated debris field looks very much like the state capitals of the continental US. I classic TSP example.
Sharp eye, Imre! :)
Yep, I re-cycled the state capitals example (which I had previously written) for my simulated debris field!
I keep having this dream. Don't know what it means but in it I see a Plane and the numbers come up 30 degrees and 65 degrees. Dont' know if it lat or log.
Hmm ... you never know - that could be the location!
65 degrees east (longitude), and 30 degrees south (latitude) is indeed in that general area (it's in the area shown near the bottom/left of this map).
They've found some plane debris on Reunion Island ... which is pretty close to longitude 65, latitude 30. So you might have been right about the crash location!
I've updated my map to include Reunion Island:
http://robslink.com/SAS/democd70/tracking_flight_mh370.htm