 This week's SAS tip is from superstar author Ron Cody and his very popular book SAS Statistics by Example. Ron has been using SAS (and writing about SAS) for a long time. And he communicates his vast expertise in a friendly, easy-to-understand manner. If you've used any of Ron's books, I'm sure you'll agree.
The following excerpt is from SAS Press author Ron Cody's book “SAS Statistics by Example” Copyright © 2011, SAS Institute Inc., Cary, North Carolina, USA. ALL RIGHTS RESERVED. (please note that results may vary depending on your version of SAS software).
Displaying Multiple Box Plots for Each Value of a Categorical Variable
If you want to see a box plot for each value of a categorical variable, you can include the option CATEGORY= on the HBOX or VBOX statement. The example that follows uses the original Blood_Pressure data set (without the outliers) and displays a box plot for each value of Drug.
Program 2.10: Displaying Multiple Box Plots for Each Value of a Categorical Variable
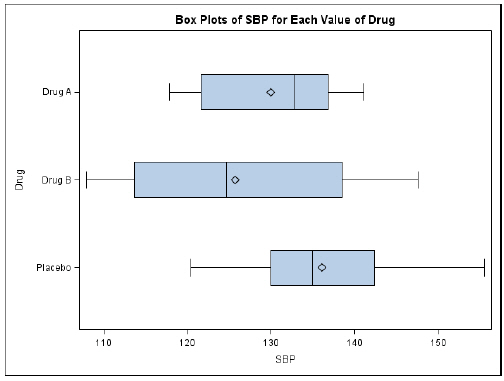
title "Box Plots of SBP for Each Value of Drug";
proc sgplot data=example.Blood_Pressure;
hbox SBP / category=Drug;
run;
The HBOX option CATEGORY= generates a separate box plot for each of the three Drug values:
If you like the subject of this week's tip or just want to learn lots more about Ron Cody, visit his author page.

1 Comment
So easy to do and gives you so much information. Box Plots are awesome!