Have you ever eaten a biscuit, and thought to yourself "well, it ain't like momma fixed it"? (Alan Jackson fans will get that one!) ... So it is with food, and so it is with numbers and dates in graphs!
Back in college, when I lived in the Alexander International Dorm at North Carolina State University, I learned that people from different countries had a different way of saying just about everything. They pronounced country names differently, and sometimes used a completely different name for the countries, than we do in the US. Sometimes the same word meant something completely different - for example, when you ask someone if they want to "shag" in North Carolina, you're asking them if they would like to do a swing-like dance to beach music ... but if that person is from the UK, they might think you're talking about something else, LOL!
Here are a few favorite word differences that always caught my attention:
- french fries/chips / crisps
- biscuit / cookie
- bathroom / loo / wc
- flashlight / torch
- trunk / boot
- parking lot / car park
- vacation / holiday
- sweater / jumper
- diaper / nappy
- line / queue
As you can see, different countries have a different way of saying the same thing ... and if you're preparing graphs for an international audience, you might want to take that into consideration. You might be thinking ... "but graphs are mostly numbers - surely numbers are the same in all countries?" Actually not! Different countries use commas, spaces, and decimals differently in their numbers. And they have different preferences for how dates are written.
So, how will you (an international SAS programmer) know what the local preferences are, when you're creating graphs for a certain country? Not to worry - SAS has nls formats that can help you with that!
All you have to do is set the locale to the language & country of your intended audience, and use formats such as nlnum. and nldate., and your graph will automatically come out the way your audience expects it! :)
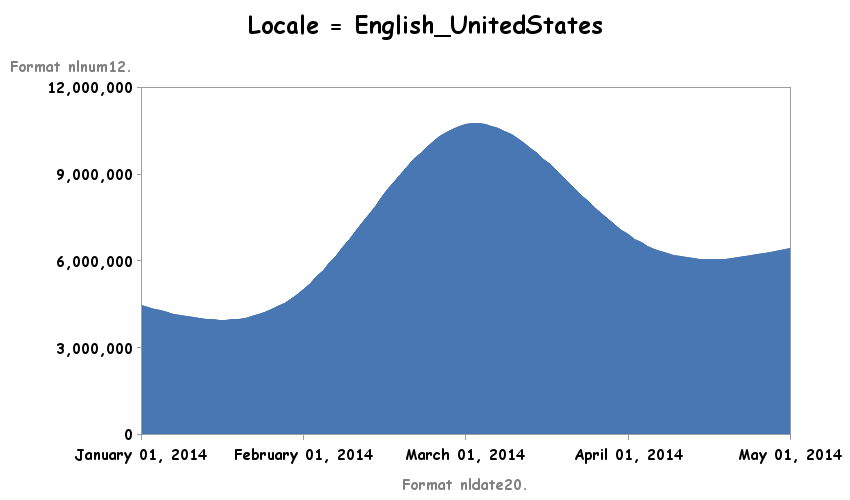
For example, if I assign these formats in my data:
data my_data;
format date nldate20.;
format quantity nlnum12.;
input date date9. quantity;
datalines;
01jan2014 4455657
01feb2014 5025627
01mar2014 10709200
01apr2014 6896904
01may2014 6439536
;
run;
And then set the following locale, then the numbers and dates in my graph will be targeted towards a US audience:
options locale=English_UnitedStates;
And now, using the exact same data & code, but just changing the locale to german_austria, you can produce a graph for an Austrian audience, using dots in the numbers where the US audience used commas.

And similarly, you can change the locale to french_france before you send the graph to your office in France - using spaces in the numbers, where the US would use commas:
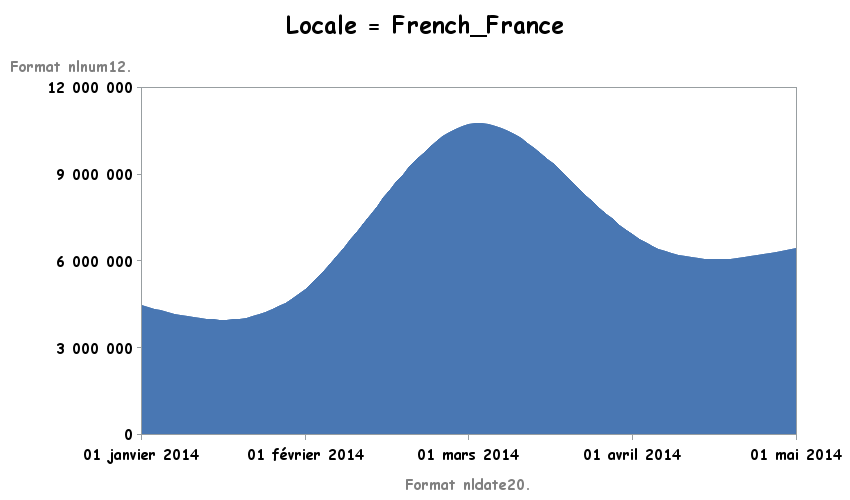
As you can see, this technique is very easy, and allows you to create graphs targeted toward your audience ... no matter what country they are in :)
Have you ever had a misunderstanding caused by audiences in different countries interpreting numbers or words differently than you did? Feel free to share the story in a comment!


3 Comments
is a first tiny step.
When preparing output for different languages, user-defined formats, variable labels and titles must be adapted. So far, I haven't seen any elegant solution for this. Here's my ugly one:
Graphs, reports, and even user-interface prompts can all be influenced by locale settings in SAS products. SAS users are very diverse in their geography and their culture -- both personally and in their business requirements.
When creating your SAS programs for an international audience, don't forget to internationalize your work for the best localized experience!
Gracias, Don Hemedinger!