One of the primary predictive modeling tools capable of fitting very complex nonlinear functions is Neural Networks (NN) in SAS advanced analytics software SAS Enterprise Miner (EM). The default option in NN EM node uses a Multilayer Perceptron model with an input, an output and a single hidden layer with three hidden nonlinearly-activating units. Each node in one layer connects with an adaptive weight Wij (tuned by the selected learning algorithm) to every node in the following NN layer. The weights (similar to the regression model coefficients) are numerical parameters that are determined by the measurement scales of input (EM default: standardized), target variables and the type of non-linear activation function (EM default: hyperbolic tangent, tanh) used. Although in many studies NNs have been shown to exhibit superior predictive power compared to traditional approaches, they have also been labeled as a ‘‘black box’’ because NN weights provide little explanatory insight into the relative influence of the inputs in the prediction process. Therefore in this blog, I will shed some light to illuminate the NN black box by providing some tips using the tools available in SAS EM.
Data and the default output: The final 28 weights obtained from SAS EM NN node with the default EM settings:
Binary target (Target_Buy1: Customer purchased: 1; Not purchased: 0) and
Six input variables:
Imputed and binary missing value indicator variable for demographic age,
Imputed and log transformed binary missing value imputation indicator variable for demographic affluent score, and
Imputed and binary missing value imputation indicator variable for Demographic gender are presented in an output table format Figure 1 and as a graphical heat map format in Figure 2.
Unlike the regression coefficient estimates in multiple linear regression, the odds ratio estimates in logistic region or factor loading weights in principal component or factor analysis models, the magnitude and the sign of NN model weights are non-interpretable due to the nature of non-linear activation function used. Despite the predictive power of NN models, the use of complex non-linear algorithms and the lack of interpretability of weights, NN tool is labeled as a black box modeling technique and therefore limits the adaptation as a popular data mining tool.
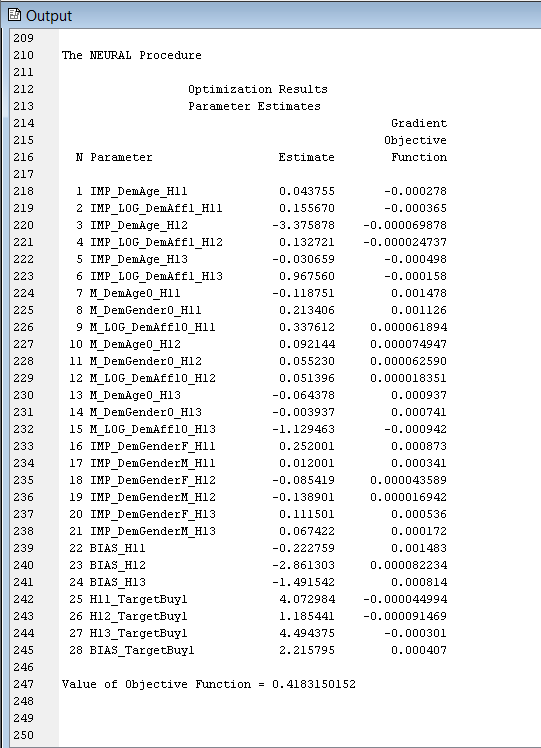
Figure 1 Final NN weights reported by the SAS EM NN node with default settings.
For example:
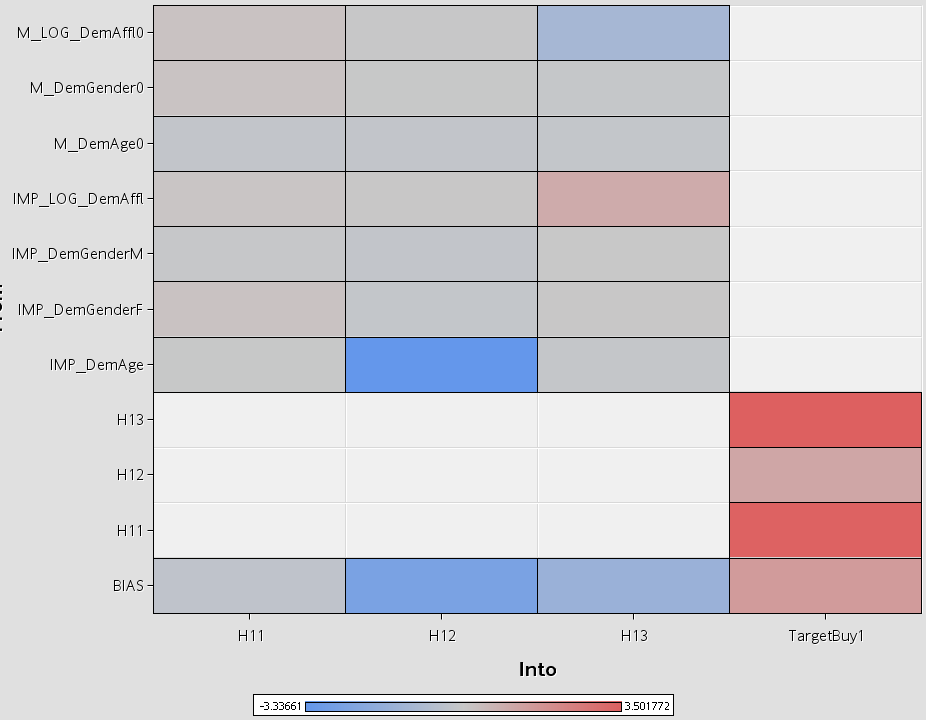
Figure 2 Heat map representation of final NN weights reported by the SAS EM NN node with default settings.
Solutions: One way to shed some light on the NN weights is to apply decision tree tool to NN prediction estimates (using predicted decision estimates as target) and interpret the NN prediction by simple English decision rules. This approach can be easily performed by connecting and modifying the Metadata and Decision tree nodes in SAS EM and we show this description tree approach in SAS Education Applied Analytics using SAS Enterprise Miner (AAEM) course training.
So this is it?? Did I shed enough light into the black box? No No Wait Wait… for some additional illumination...
We know the names and the types of input variable NN used to build the predictive model. Because NN lacks the variable selection feature, it is customary to perform a variable selection first and then forward the selected variables as in inputs in NN. (Please note: Only the selected inputs from a stepwise regression model selection were used as inputs for NN).
In this example 6 derived variables (imputed/transformed and missing value indicator) from three predictors (Dem_age (interval), Dem_gender (nominal), and Dem_ Affluent score (interval)) were forwarded to NN node. However, the default NN output is very complicated to understand and interpret (See Figures 1 & 2).
Is there a quick and simple way to rank the three predictors based on relative worth in relation to NN model target prediction?
Yes, please see Figure 3 where the three predictor variables are ranked based on relative worth information and both Dem_gender and Dem_Affl contributed relatively higher than Dem_age variable in NN predictions.
You might be thinking. That is great. But it is not enough and I need more insight.
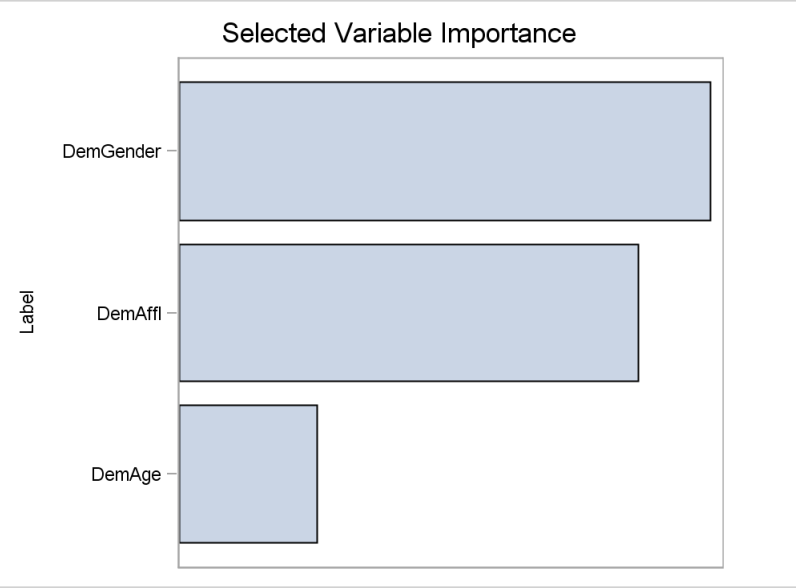
Figure 3 Bar chart showing the relative worth of original 3 predictors related to NN prediction.
For example, which gender (male or female), which affluent group, and which age group (younger, mid-age and older) had more affinity towards purchasing the product of interest?
Please see Figure 4 for the answers based on relative importance score points for all group levels within each predictor variable:
Female customers showed relatively higher affinity towards purchasing compared with male and unknown gender levels based on the score point distribution within dem_gender group.
Customers having an affluence score greater than 10 have a relatively higher affinity toward purchasing compared with customers having an affluence score less than 10.
Younger customers (age less than 44 years) have relatively higher affinity toward purchasing compared with older customers.
Definitely this kind of interpretation helps you shed the light on the black box consisting of NN predictions. Next question: Now you may be wondering... how did I generated these two outputs? (Figures 3 & 4)
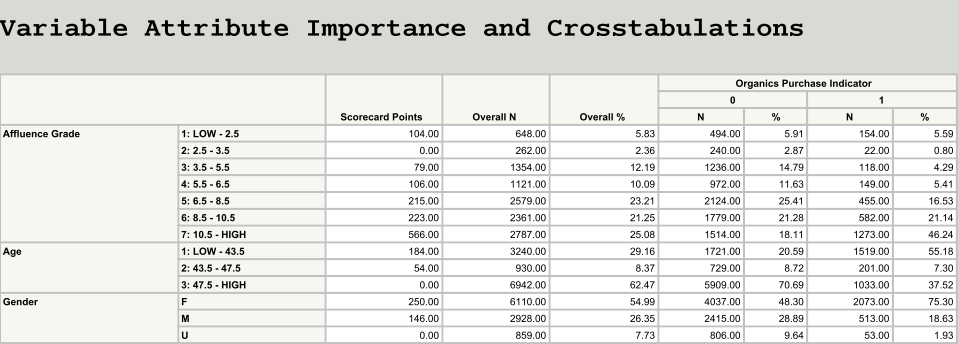
Figure 4 Scorecard points showing the relative importance of group levels within each predictor variable in NN.
Did I use SAS code node, advanced tool nodes or any complicated macros or stored processes to generate these output?
The simple answer is no.
I connected the following three standard EM nodes to NN in the following sequence (See Figure 5):
1) Connected a model comparison node with the default settings to the modelling node (In this example NN)
2) Then connected a scoring node with the default setting to the model comparison node
3) Then connected a reporter node with a modified settings (see Figure 6 for the change in default settings)
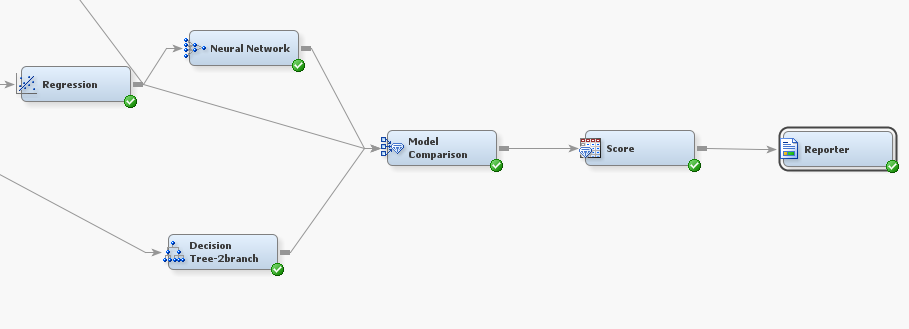
Figure 5 the connection sequence of EM process flow showing the required node sequence for this report generator.
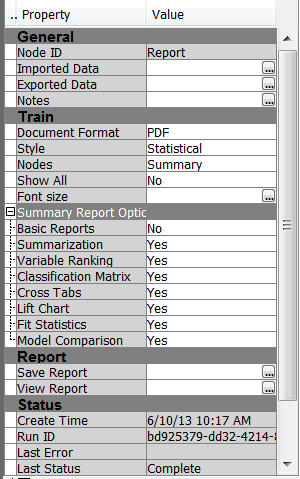
Figure 6 Change the node property to “Summary” and the “Show All” property to “No” in the SAS EM Report note property window.
So what is going on with these 3-node sequences?
If you recall the application of SAS EM rapid predictive modeler (RPM) with the Basic model option, the same three nodes were used in producing the report generated in interpreting the binary logistic regression output.
Trick: Connecting a model comparison node to the desired model tool (NN, REG, DT or model selected by the model comparison node) and connecting a score code node are essential steps to produce the summary report produced by the Reporter node. It appears that the summary report macro perform an optimal binning of all inputs based on the strength of association with the target, then fit a logistic regression with binned input and within each input rescale the regression coefficients values to easily interpretable relative score points. It identifies the lowest important level (E.G. Binned Age level 47.5 to High See Figure 4) and assign a 0 score and then compute a relative scores for other levels within each input.
This type of output is very helpful and useful to understand the results of highly complex predictive models such as NN. The same approach should work for any other complex and model interpretation within SAS EM.
Next time try these steps and see the magic.

4 Comments
Pingback: Neural networks demystified - SAS Voices
Respected Professor
I recently bought your book "Statistical Data Mining Using SAS Applications". I have tried to download the SAS Macro zip file as per your instruction in the book (Appendix I). When I clicked download link, the system does not take to the download page but to Error 404 - Page Not Found! message. I found your book very useful but I am not being able to use the macros. I discovered that you are currently working at SAS institute and no longer with University of Nevada at Reno. Please help me to access these macros so that I can use them and practice Data Mining. I have a great interest in predictive analytics and preparing for certification on Predictive Analytics. I would highly appreciate your kind assistance in this regard. I was in Sri Lanka in 1997 for about a month. I am originally from Nepal. Thanks
V/R
Gopi Upreti
Email: goupreti@gmail.com
Telephone: 316-305-0647
Pingback: Neural networks demystified - Value Alley
George,
Looking for you in conjunction with your DM in SAS book. Is there a public email address for you I might use?
thanks