Your biggest problem with maps used to be learning how to fold a paper road map. Today, with the advent of GPS, Google Maps, and location-specific data, the bar has been raised! ... you now need to know how to plot your data on a map!
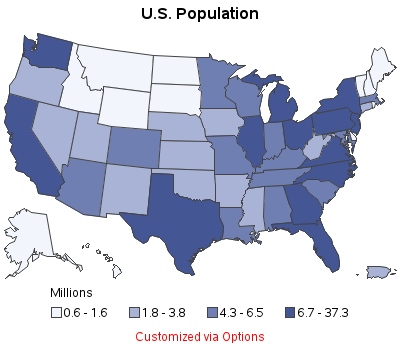
Below are several examples of different kinds of maps you can create with SAS/GRAPH to help analyze your data. And at the bottom of the blog, you will find a link to the full tutorial, with easy step-by-step directions for creating all of these types of maps -- three cheers for FREE tutorials!
Basic Maps
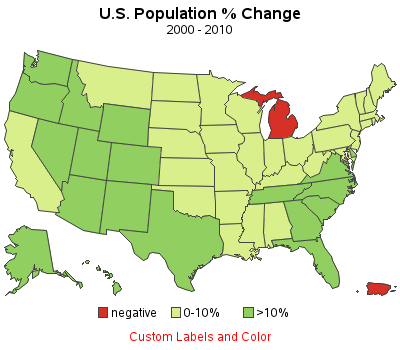
Custom Color Binning
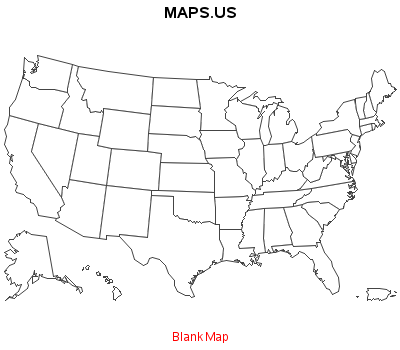
Creating Blank Maps
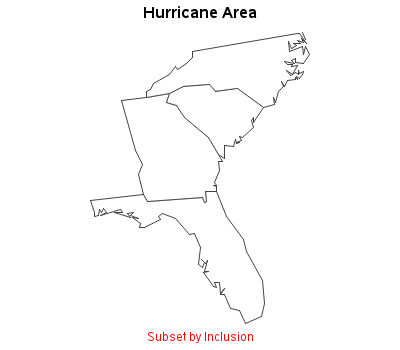
Subsetting Maps
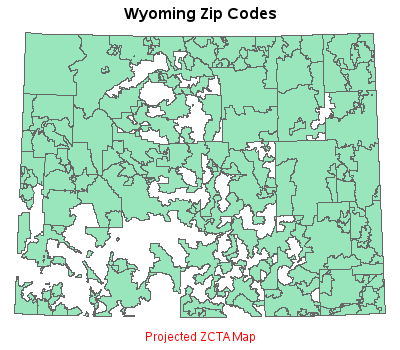
Importing Maps (such as zip code maps)
And, as promised, here are links to the PDF files for the tutorial:
Do you like the format of this tutorial? What other kinds of charts/graphs/maps would you like to learn about? I'd love to hear your feedback and suggestions!
Click here to see my other tutorials on creating basic graphs!

8 Comments
Hello. How in SAS VA can I specify the radius for custom objects that are specified by latitude and longitude?
I'm not sure how to do it in SAS Visual Analytics (VA). Perhaps you could post the question in the VA community forum: https://communities.sas.com/t5/SAS-Visual-Analytics/bd-p/sas_va
Hi,
I have the zipcodes of areas in my table, and I want to know the geographical spread of the data points on a world map.
Is it possible in SAS?
SAS' Proc Geocode can provide a lat/long centroid estimate for US zipcodes, and you can then plot those US lat/longs on a US (or world) map. (But we don't currently have a way to geocode zipcodes from all countries of the world.)
What I am trying to do is work up a GEO map pinpointing where the alumni of my school live, with the ability to click the balloons and get the individual's name, plus a bit more information about them. I would like the ability to call them up by class year and, later, highlight a given geographical area and see who pops up.
You could annotate color-coded dots/bubbles on a map to show the location of alumni on a map using Proc GMap. Here's a chapter I wrote on that:
http://robslink.com/SAS/book2/Chapter_07_Annotating_on_Maps.pdf
If you're wanting a lot of interactivity, such as filtering/subsetting data on the fly, you might want to check into the mapping capabilities of SAS Visual Analytics.
Very timely... Was asked today about mapping in SAS/GRAPH and your tutorial is a great walk through of PROC GMAP. Thanks!
And thank *you* for teaching people SAS! :)