Do you know how to create a bar chart using SAS, and when to use what kind of bar chart?!? If the answer doesn't come to you "easy as pie" then this blog is for you!
Below are several examples of different kinds of bar charts you can create with SAS/GRAPH. And at the bottom of this blog, you will find a link to the full tutorial, with easy step-by-step directions for creating all of these charts - for FREE!
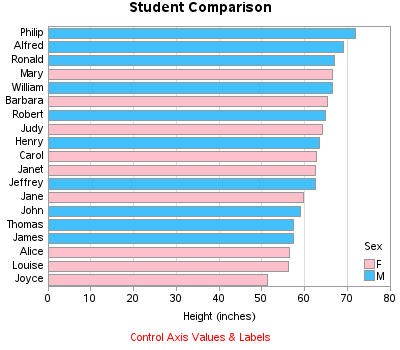
Simple Bar Chart
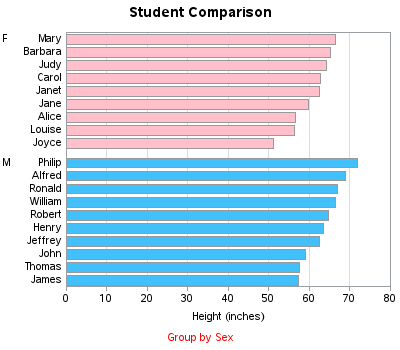
Grouped Horizontal
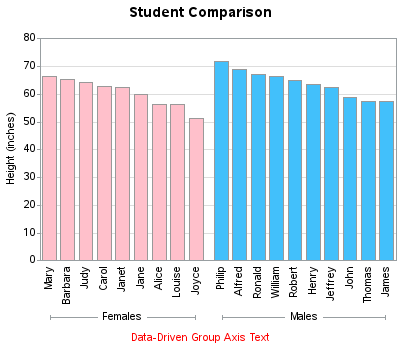
Grouped Vertical
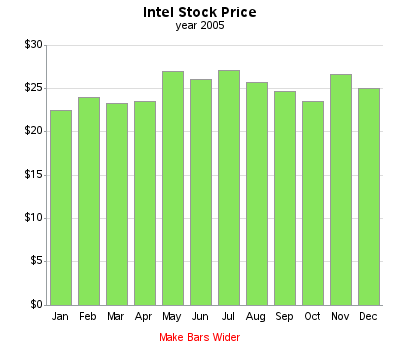
Date Axis
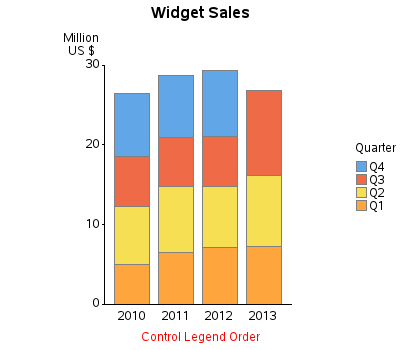
Stacked
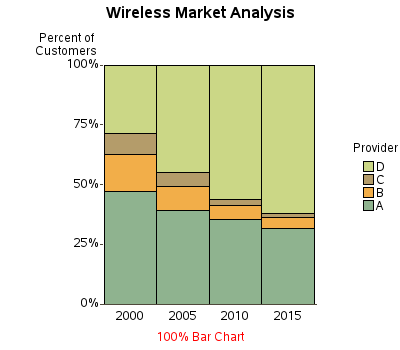
100% Stacked
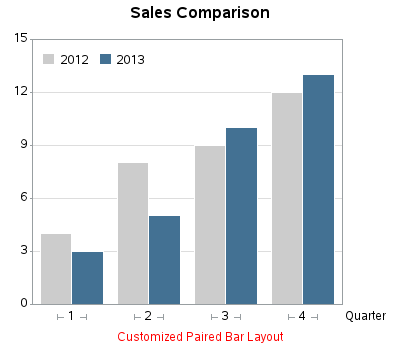
Paired
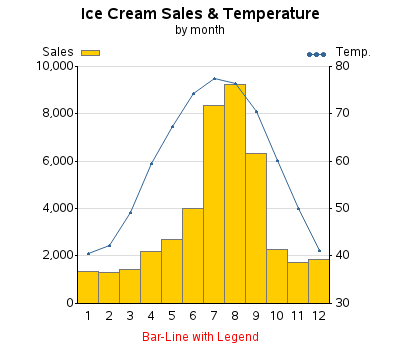
Bar-Line
And, as promised, here are links to the PDF files for the tutorial:
Do you like the format of this tutorial? What other kinds of bar charts would be useful to include? I'd love to hear your feedback and suggestions!
Click here to see my other tutorials on creating basic graphs!


4 Comments
Great!
Hi Robert,
Thanks for the "Beginner's Tutorial" Series on various types of graphs. I still have to Digest all this VITAL wealth of Information shown by you. Can you also present one on PIE CHARTS which too are commonly requested of SAS Developers by their Bosses?
Sincerely,
Prashant
You asked for it ... you got it!
I plan for my very next blog to be a big-ole slice of Pie Chart tutorial! :)
The pie chart tutorial is ready ... see today's blog:
http://blogs.sas.com/content/sastraining/2013/09/17/a-beginners-tutorial-on-pie-charts/