I've heard many customers ask "Can SAS do/use/handle census block maps?"
My answer was "of course!" ... but I never really had any examples to show/prove that. Well, now I do! :)
First, you need to locate & download the shape files for the census blocks you're interested in plotting. For the 2010 U.S. census, here is a link to one location where you can download the files from the census web site. Each state has a zip file, with the FIPS code for that state in the name. For example, North Carolina is FIPS code 37, and the North Carolina zip file is named 'tabblock2010_37_pophu.zip'.
Once you download and extract the zip file, you can import the shape file into a SAS data set using Proc Mapimport, such as ...
proc mapimport datafile="tabblock2010_37_pophu.shp" out=tabblock2010_37_pophu; id blockid10; run;
The output SAS data set (tabblock2010_37_pophu) contains both the x/y coordinates for the borders of the census blocks, and also the 2010 population of each block (stored in the variable named pop10).
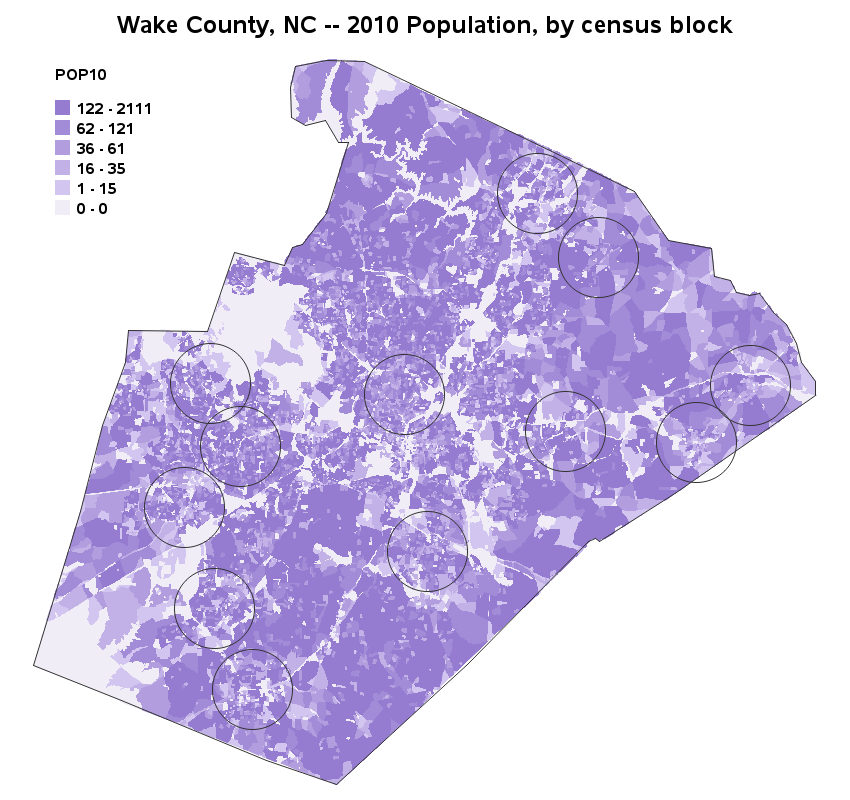
Census blocks are very small/granular areas, therefore if you try to plot the entire state and shade each area, your computer screen just won't really have enough pixels for you to discern each census block. I would recommend subsetting to show just one county. For example, here is a map of Wake County, NC (where the SAS headquarters is located):
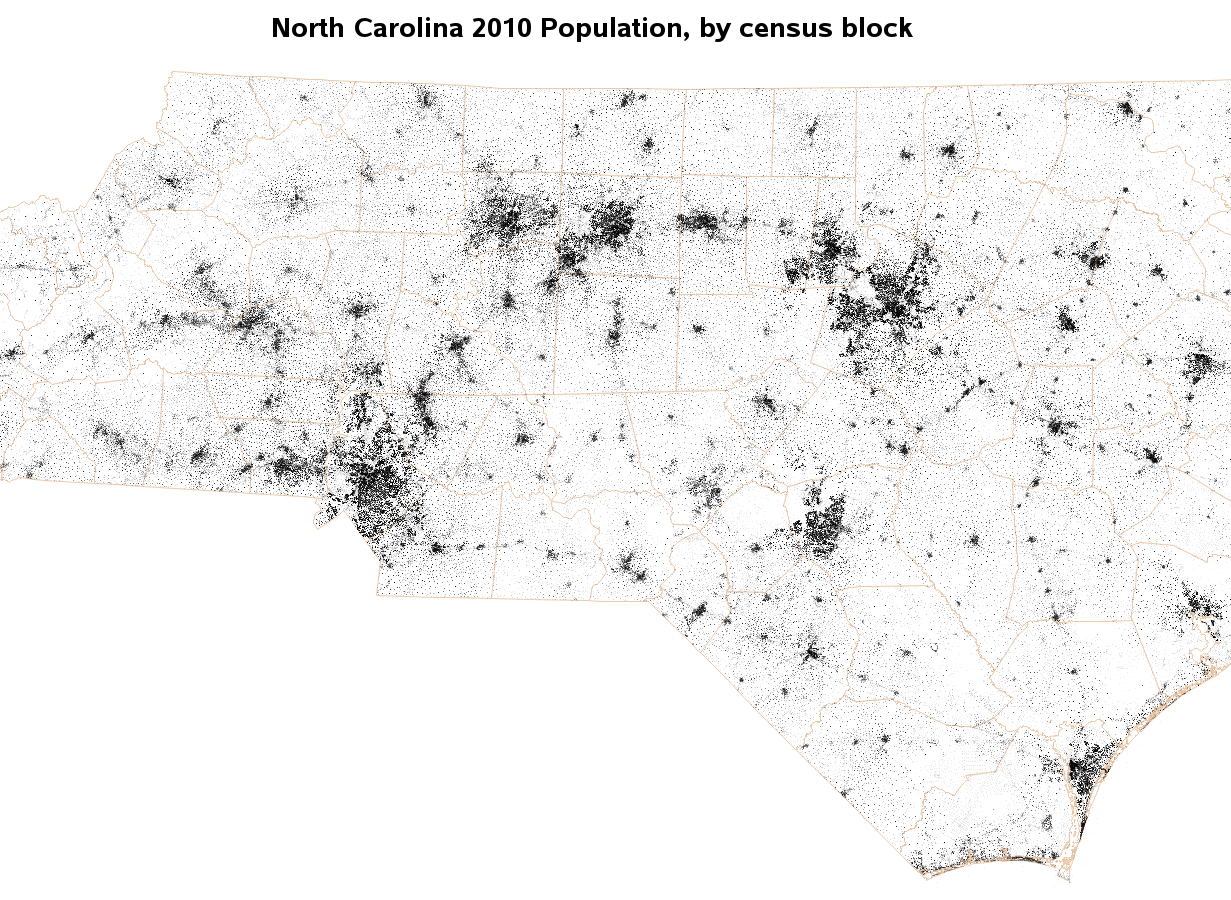
But what if you *do* want to show the entire state population at the block level???
The approach I took was to calculate the center coordinate of each census block (using the %centroid macro), and then plot a single annotated 'point' at that center, and make the color of the point represent how many people live in that census block. You could set the color variable manually in a data step using if/else statements, but in this example I decided to try out a new (upcoming) feature in SAS 9.4 where I stack/overlay alpha-transparent gray points in the same location (the higher the population, the more points I stack, and the darker the point will appear). I think you will like the results!
Be sure to click each of the maps above, to see them full-size, and the full-size map will allow you to hover your mouse over the cities and see the city names!
And if you'd like to see the exact SAS code used to create the above examples, here are links for the choro map, and the dot map . This is a great way to apply the skills you learned in the SAS Mapping Class! :)


1 Comment
Thanks Robert. I'm trying to get this to work for Chicago Census Tracts, but my map is blank! I have a legend at the bottom of a blank square where I want the map to be. I've used different sources for my .SHP, .DBF, and >SHX files, and it makes no difference. I'm getting this warning:
WARNING: ID variable tractce10 is of length 6 in response data set and length 254 in map data set. This might result in ID values not matching or multiple regions to be combined.
However, the contents of my shapefile are:
List of Fields and Attributes
# Field Type Width Decimals
1 STATEFP10 CHAR 2 0
2 COUNTYFP10 CHAR 3 0
3 TRACTCE10 CHAR 6 0
4 GEOID10 CHAR 11 0
5 NAME10 CHAR 7 0
6 NAMELSAD10 CHAR 20 0
7 MTFCC10 CHAR 5 0
8 FUNCSTAT10 CHAR 1 0
9 ALAND10 NUM 14 0
10 AWATER10 NUM 14 0
11 INTPTLAT10 CHAR 11 0
12 INTPTLON10 CHAR 12 0
26 ID TRACTCE10;
27 run;
My code:
proc mapimport datafile="&mapdata.\tl_2010_17031_tract10.shp"
out=mapdata.'2010CountyTracts'n CONTENTS;
ID TRACTCE10;
run;
PROC IMPORT FILE="&mapdata.\selected census data.csv" dbms=csv OUT=mapdata.'2010CensusData'n REPLACE; RUN;
data mapdata.'2010censusdata'n;
set mapdata.'2010censusdata'n;
tractce10=put(tracta, 6.);
/*tract2 = put(tracta,6.);*/
/*RENAME tracta=tract2;*/
/*format pct: percent.;*/
RUN;
proc gmap data = mapdata.'2010censusdata'n map=mapdata.'2010CensusTracts'n all;
id tractce10;
choro pct_white;
run;