It’s been quite a while since my face has graced the SAS Training Post, so some of you may have been wondering: Did Mike retire? Was he traded to another company for a blogger to be named later? Did he leave to pursue his lifelong dream of playing first base for the Detroit Tigers?
Well, the answer (mostly) is that I was locked away in my office and told not to come out until I had developed the course that many of you have been asking for: ODS Graphics: Essentials. As my presence on this page indicates, the moment you have been waiting for is here—they’ve unlocked my office door, and the course is ready!
The course provides all you need to create commonly-used graphs using ODS Graphics. You’ll learn how to write programs to produce
- scatter plots
- line graphs
- regression plots
- bar charts
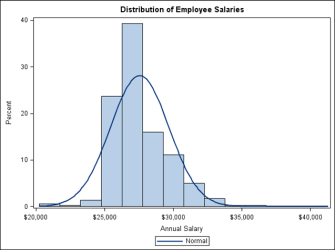
- histograms
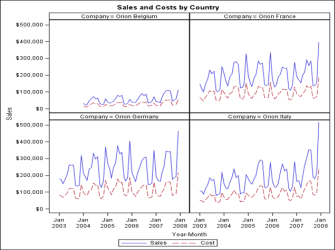
and many other commonly used types of plots and charts, including multi-panel graphs. Here are a few examples:

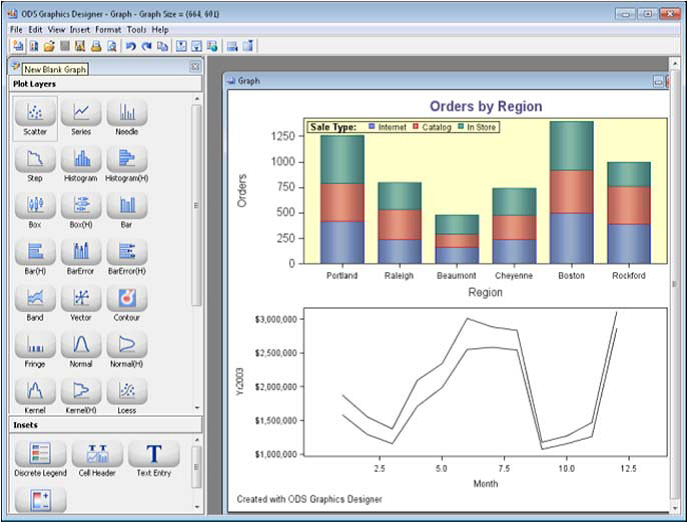
A great feature that we cover in the course is the ODS Graphics Designer, a point-and-click interface that enables you to produce all of the types of graphs listed above, and save generated layouts and code or later reuse. Below is an example of a graph that I created using the ODS Graphics Designer:
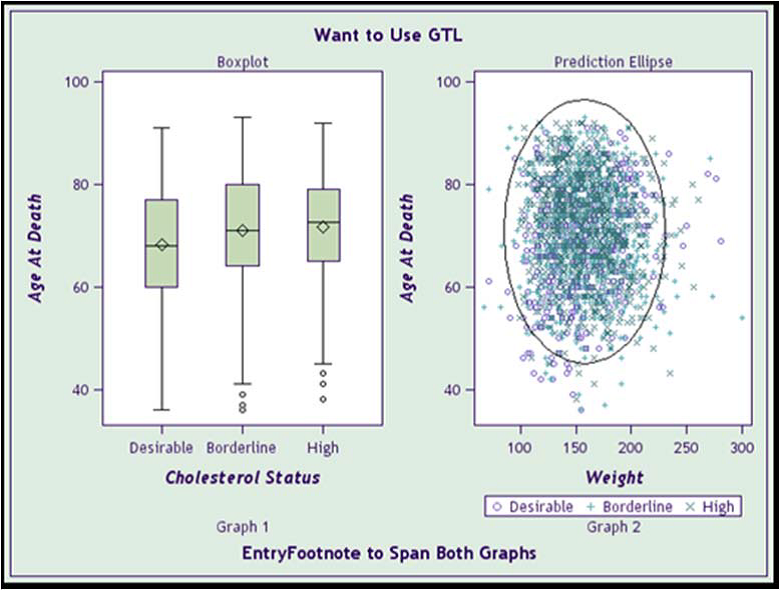
If you want to create custom graphs with complete programmatic control over your layouts and graph appearance, the course will show you how to use the Graphics Template Language and PROC SGRENDER. Here’s a graph created using this approach:
If you’re a current SAS/GRAPH user and have used the Annotate feature, you’ll be glad to know that the SG Annotation facility gives you the same capabilities in ODS Graphics.
ODS Graphics: Essentials is an introductory-level course, so you don’t need any previous SAS/GRAPH or other graphics experience. If you have used SAS/GRAPH in the past, it’s still alive and well, and you can use either SAS/GRAPH or ODS Graphics to produce your graphs. If you’re unsure which one to use, check out Cynthia Zender’s posting “Are You At a Graphics Crossroads?” for advice.
Getting back to the question in the first paragraph: Did Mike retire? The answer is—Yes! After more than 31 wonderful years with SAS in Technical Support and Education, I retired from SAS last October, after finishing my work on ODS Graphics: Essentials. But you don’t get rid of me that easily! The folks at SAS have invited me to teach ODS Graphics: Essentials, and another course, Producing Maps with SAS/GRAPH, as a contract instructor. Hopefully, I’ll see you in the classroom or talk to you via Live Web over the next few months.
Meanwhile, I’m still waiting for the phone call from the Tigers…..

1 Comment
Congratulations to you, Mike and also to Cynthia for putting together this course. It is amazing, the amount of information you have packed into this class. I feel there are many audience segments that will benefit from this course:
1. Graph programmers wanting to use SGPLOT, SGPANEL and SGSCATTER procedures.
2. Users who want to create graphs without code using the interactive ODS Graphics Designer.
3. Advanced graph programmers using GTL.
We continue to build and enhance this graphics framework so I am confident this will be in demand for a long while.