
This week's tip is from Gerhard Svolba and his book Data Quality for Analytics Using SAS. Gerhard is a product manager and pre-sales consultant at SAS in Austria, where he specializes in analytics and customer intelligence. Visit his author page to learn more about him and his work.
The following excerpt is from SAS Press author Gerhard Svolba and his book "Data Quality for Analytics Using SAS". Copyright © 2012, SAS Institute Inc., Cary, North Carolina, USA. ALL RIGHTS RESERVED. (please note that results may vary depending on your version of SAS software)
Outlier detection with ARIMA(X) models
The detection of outliers is a very important topic in time series analysis. ARIMA(X) models can be used to filter the effect of detected outliers. The process, in this case, is as follows:
- An initial time series model is fit based on the available data.
- Those observations that are considered as outliers based on their deviations from the predicted values are flagged.
- A new model is fit that also includes the dummy variables for the detected outliers.
- Based on the new model, new observations might be considered as outliers, and the process repeats itself.
SAS Forecast Studio provides this functionality for ARIMA models. You can set the option in the DIAGNOSTICS tab of the FORECAST SETTINGS. Figure 13.1 shows an example.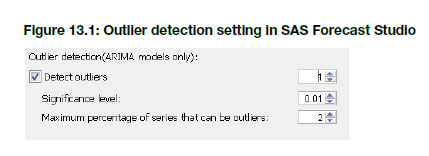
Output 13.2 shows the model’s resulting graph in SAS Forecast Studio. Here, the historic observations are shown as circles and the forecast is shown as a solid line. It appears that some observations have unusually high values.
The ARIMAX model that has been built for these data with the detect outlier option identifies the observations in February 2007 and October 2008 as outliers.
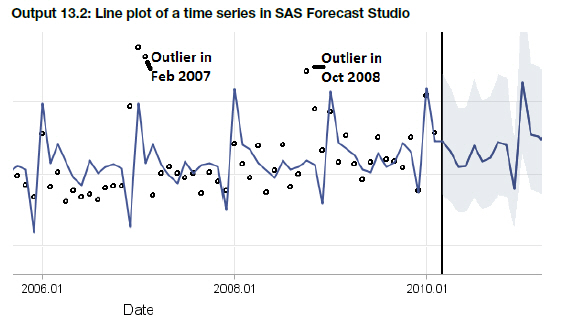
The graph annotates the observations that are considered as outliers. It can be seen that the value in January 2007 (in the upper left next to the outlier in February 2007) is not flagged as an outlier, although the value is larger. In January, values are higher in general so such a value is not seen as out of range, while in February the expected values are usually much lower.
Similar to the predictive model that was shown in the previous section, analytic models here allow you to make a more intelligent judgment about the outlier status of data values.
