While I'm waiting for the next "data intense" event to show up in the news (so I can blog some SAS graphs about it), I thought I'd share a few fun SAS graphs in the spirit of the holiday season!
Please don't hold me to too high of graphical "best practices" standards on these - they're mostly for entertainment, (but who knows - you might pick up some graphical tips/ideas you can use).
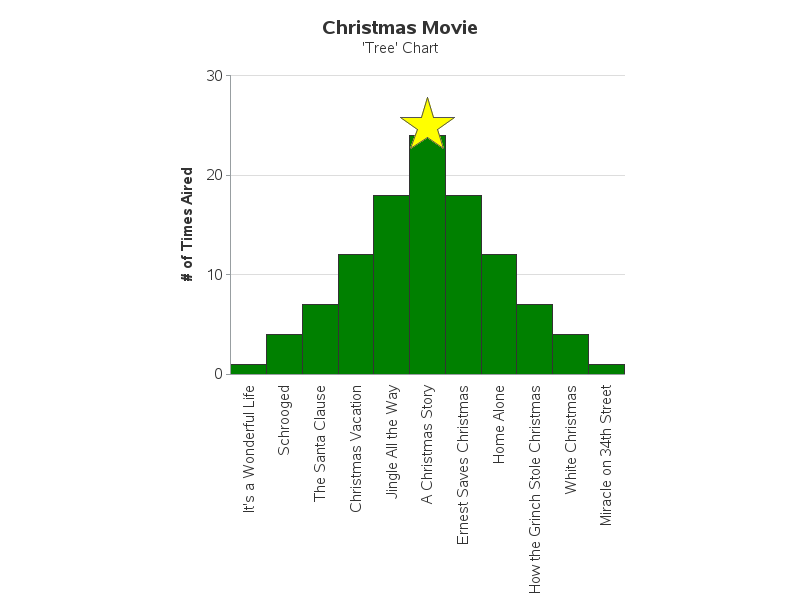
First, how about a bar chart comparing the popularity of Christmas movies (which is my imitation of this graph from blogspot.com). And just by coincidence, it looks like a Christmas tree! I know, I know, it would be easier to read the bar labels if it were a horizontal bar chart, and it might be more useful to sort the bars by height ... but then it wouldn't look like a spruce tree, now would it! ;-)
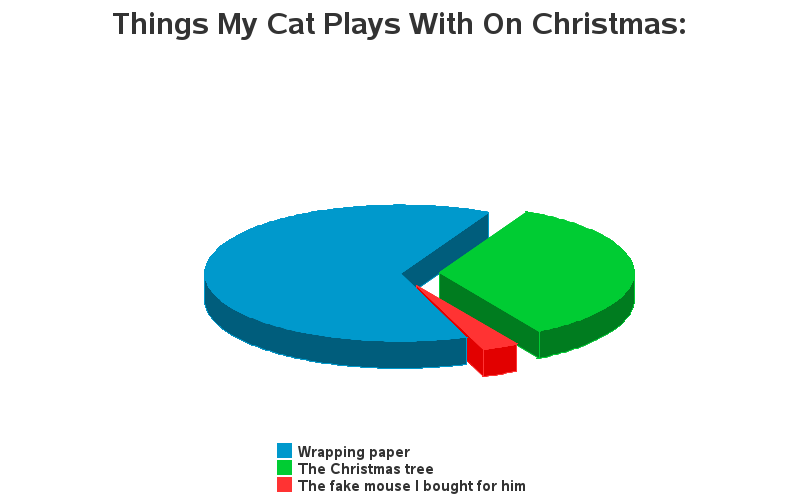
Next, a dreaded 3d pie chart, which is my imitation of the original graph from graphjam.com. Again, I plead the holiday spirit! It would certainly be a more proper chart in 2d, or maybe even using a bar chart instead ... but hey, it's about cats!
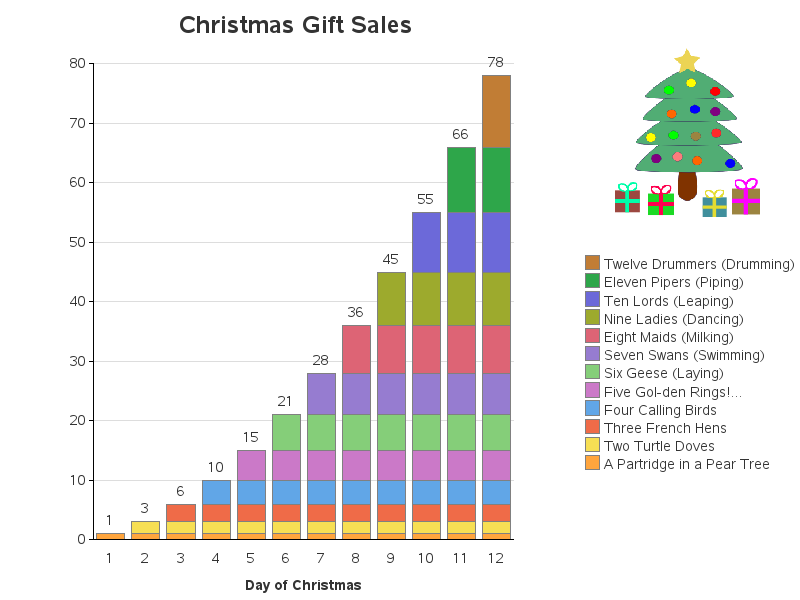
Did you ever wonder about how many gifts were mentioned in the "12 Days of Christmas" song? Well, here it is in graphical form. (This is my SAS enhancement of the original graph from graphjam.com - the SAS version looks much better, don't you think?)
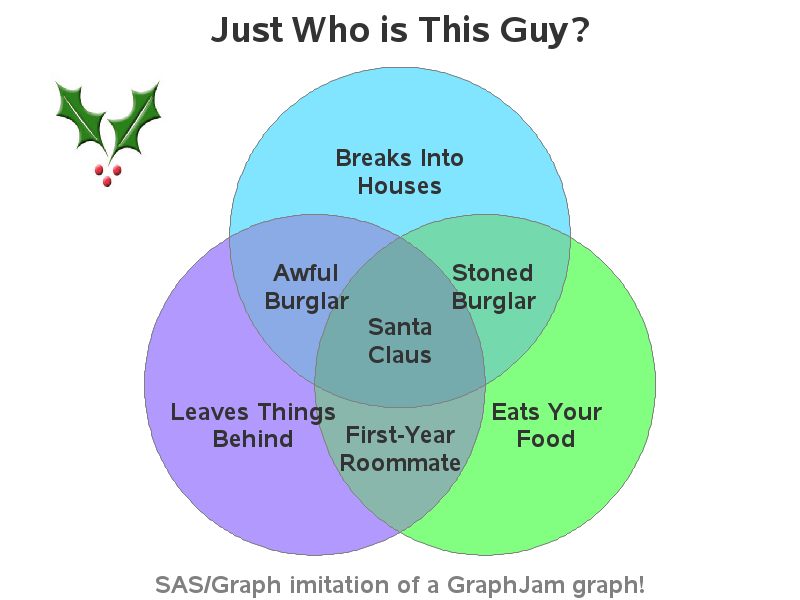
And of course I saved my favorite for last! Here's a Venn diagram showing the unlikely combination of factors that add up to Santa Claus! (This is my imitation of a graphjam chart that is no longer there.)
Hopefully these graphs have entertained you a bit, and maybe even given you some ideas of other (useful) things you might can do with SAS. If you'd like to see the code for any of the above examples, follow these links: graph1, graph2, graph3, graph4.


8 Comments
Pingback: Interesting analytics for the holidays! | The SAS Training Post
is it possible to import data from word file.
SAS can import data from text files, spreadsheets, lots of database formats, etc ... but I don't think it can import data directly from a word file (word processing document). You might call that question in to SAS Tech Support though, to get a definitive answer.
One work around would be to open the file with Word, and write/export it as a text file. Another work-around might be to copy-n-paste the data to an Excel spreadsheet, and then import it from the spreadsheet into SAS.
Pingback: A fractal Christmas tree in SAS - The DO Loop
Really enjoyed this - though I'm a little weary of the pie chart, I think the fake mouse you bought him was used far less than you're letting on! I have a few questions about SAS - would it be possible to have a quick chat through e-mail with you? Would really appreciate it!
Hahaha! - You might be right!
(p.s. I'll send you an email to start our discussion.)
Robert, when you called it "a dreaded 3D pie chart", you COULD have referred your readers to Figure 1 in http://www2.sas.com/proceedings/forum2007/134-2007.pdf so that they would understand the reason why. The paper includes some GOOD pie charts.
I understand that you could not be too fussy about data reality for the Christmas Movie Tree Chart, but the middle bar could more appropriately have been Homes Alone, or Home Alones? I think that there are now four of them. But the really unfair treatment is for the two oldest movies in your tree, It's a Wonderful Life and Miracle on 34th Street, which are your end bars. I think that they should flank the middle bar. But the cruelest part is total omission of Charles Dickens' A Christmas Carol. It probably should have been the middle bar. But I'm just a guy who likes old movies, old books, and old stories.
Thanks for the link to the paper explaining pies!
Per the Christmas movies - I wouldn't be too surprised if the author of the original chart "fabricated" the data ... but all in the spirit of holiday fun! ;-)