Hopefully you know that a gif animation can be used for more than just showing a cartoon animal doing cute tricks! Being a savvy data-meister, I'm sure you are also aware that you can use gif animations to see how data changes over time.
But perhaps you didn't know you could use SAS/GRAPH to create gif animations? Or perhaps you weren't sure of the exact code to use? Hopefully this blog will pique your interest, and this example code will help you start creating your own gif animations!
---
Recently, Gordon Keener (one of the SAS R&D legends) gave me a graph challenge. Researchers from UCLA had developed a technique for tracking the paths of individual stars -- their research is helping prove the existence of a black hole near the center of the Milky Way galaxy. Gordon sent me a link to their raw data, and asked if I could graph it (i.e., he "threw down the gauntlet") ... how could I resist?!? :-)
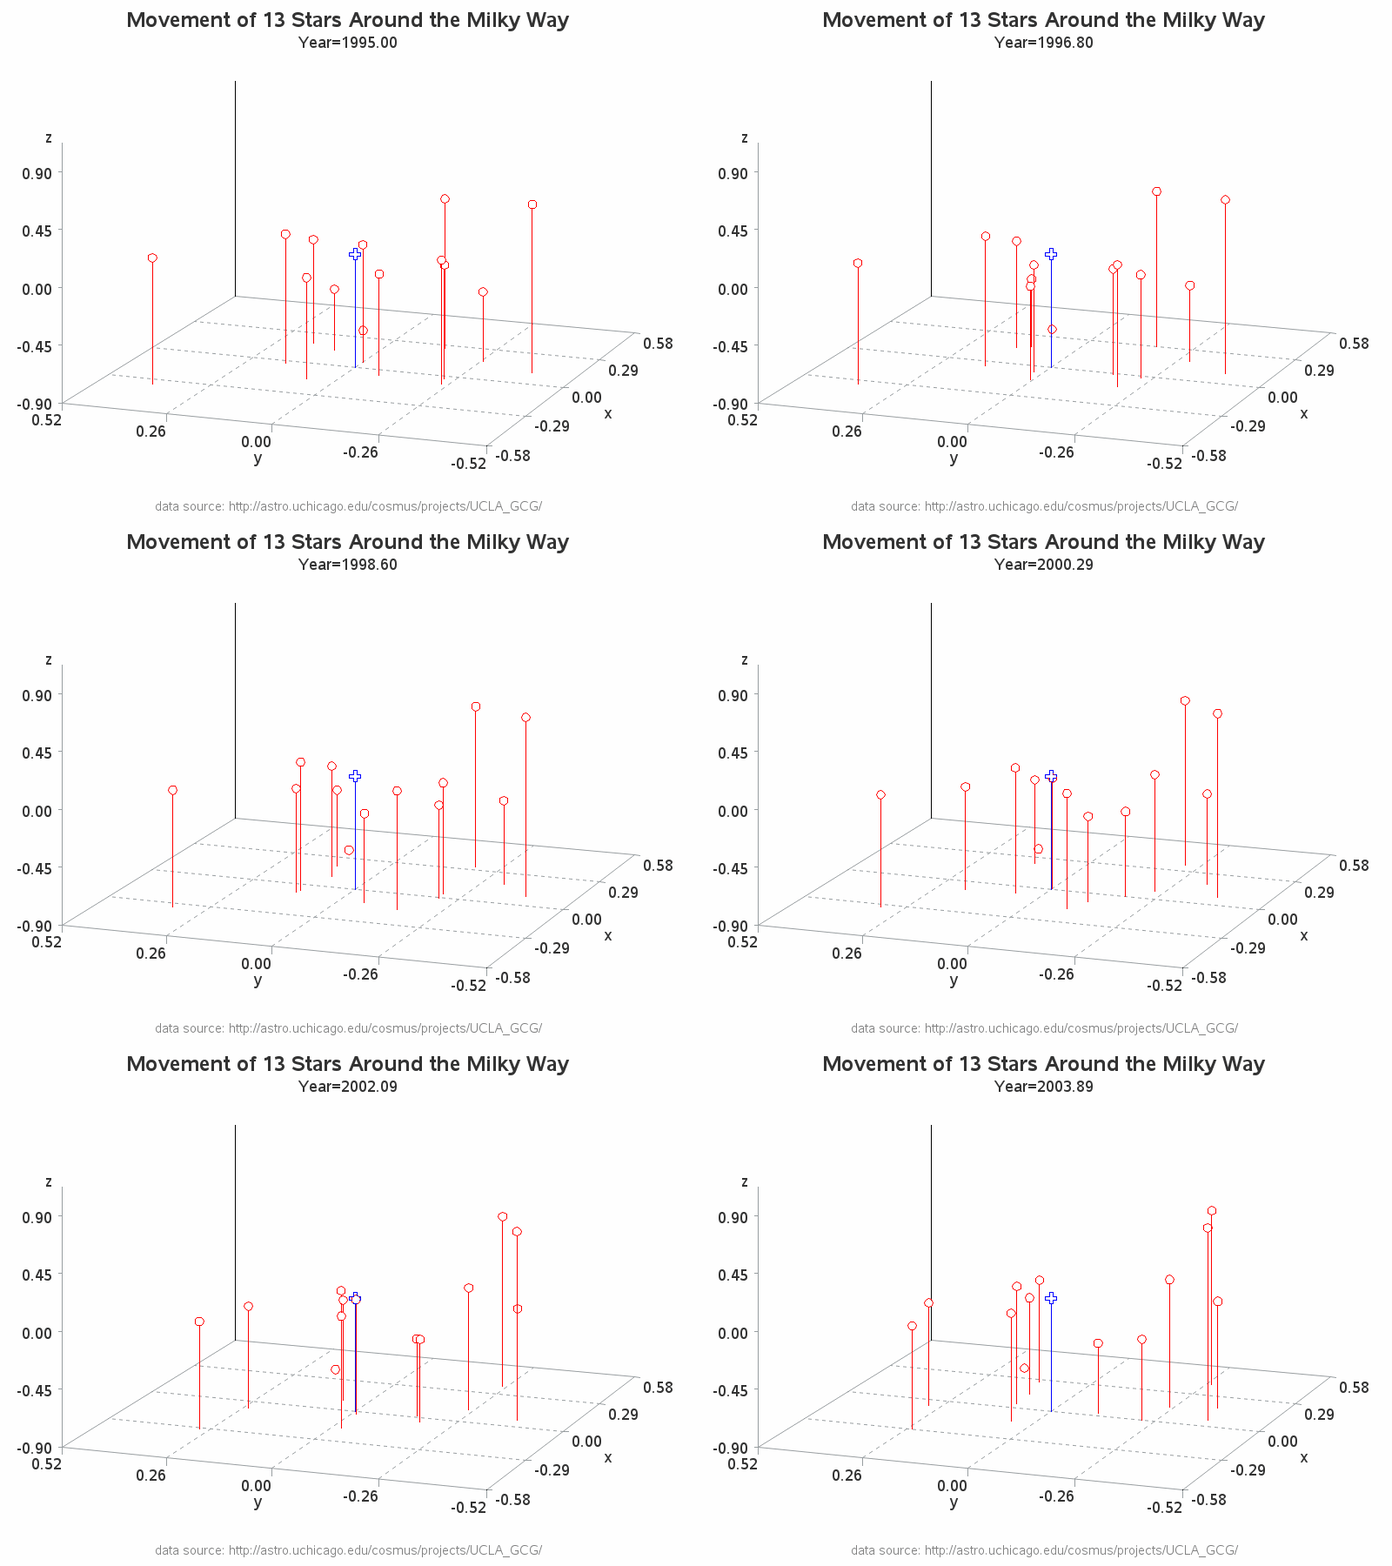
Here is the graph I came up with - a 3d gif animation. Notice that the orbits of the stars look very similar to the orbits of planets around the Sun, moving faster as they get closer to the black hole.
How do you create similar gif animations in SAS?
My SAS code reads the raw data directly from the web (without having to save it to my hard drive ... which is in and of itself pretty cool, IMHO!) and then plots it using proc G3D. I use a 'by' statement, and each 'by group' produces 1 frame in the gif animation.
Once I've read the data in, I use the following code right before I create all the graphs (one graph for each time snapshot). The animduration controls the speed, and the animloop=0 tells it to keep looping the animation endlessly.
options dev=sasprtc printerpath=gif animduration=.15 animloop=0
animoverlay=no animate=start center;
A trick I had to use with this particular graph is that I add some 'fake' data to represent the maximum extents of the desired axes (so G3D will always pick the same auto-scaled axes). I also insert a reference point at (0,0,0) and have it plot with a cross-shaped marker to represent the 3D origin (which is also the hypothetical location of the black hole).


2 Comments
In most browsers, you can "refresh" the page to re-start the animation :-)
In the SAS code, you can set iteration=0 to create an animation that loops endlessly.
I usually recommend against endlessly-looping animations. One reason is that it is often difficult for users to know when the animation is "done" if it loops back to the beginning. Also, if people happen to leave their browser on a page with an endless animation, it could consume a lot of cpu (this preference probably comes from my days as a Unix sys admin, in charge of "policing" the cpus on several hundred shared Unix servers :-)
Typically, I only create endless loops for special displays on a demo table, etc.
That's nice.
Is there a way of making it loop constantly?
Say in my case, I was reading the intro and by the time i got to the graph it was stopped.