 When asked to select the best (or worst) of something in a business setting, do you wish you had "magic glasses" to see the answer?
PROC GLM and other statistical modeling procedures have their own versions of such an item with their ESTIMATE (and CONTRAST) statements. They allow you to assess whether one scenario is better than another based on your data, and provide a way to make informed decisions.
For example, consider a study to explore what affects memory[1]. One theory is that material is recalled as a function of how much it is processed when first encountered. Fifty younger subjects and 50 older subjects (between 55 and 65 years old) were randomly assigned to one of five learning groups: Counting (read a list of words and count the number of letters in each word); Rhyming (read each word and think of a rhyming word); Adjective (think of modifiers for each word); and Imagery (form vivid images of each word). None of these groups were informed that they would need to recall the words at a later time. The last learning group, Intentional, was told to memorize the words for later recall. After the subjects had gone through the list of 27 items three times, they were asked to write down all the words they could remember.
Of interest is the number of words recalled (Words) and the categorical predictor variables Age (Younger/Older) and Process(Adjective, Counting, Imagery, Intentional, and Rhyming). One interesting hypothesis is that forming vivid images of each word would be more effective for later recall as compared to intentionally memorizing each word; this can be formally tested with an ESTIMATE (or CONTRAST) statement in PROC GLM.
The results of the study can be visualized in the following series of paneled boxplots:
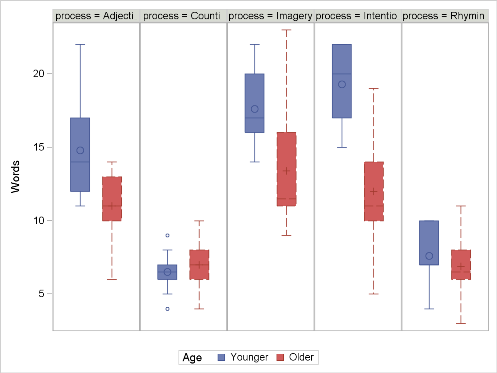
The number of words recalled appears to differ by Process and by Age. When analyzing this data set, it seems reasonable to include an interaction of Process by Age, since the histograms of Process appear to differ by Age:
proc glm data=recall; class age process; model words=age|process; run; quit; |
The ANOVA table that follows indicates a significant interaction between Process and Age, making an ESTIMATE statement more challenging to write.
| Source | DF | Type III SS | Mean Square | F Value | Pr > F |
| Age | 1 | 240.250000 | 240.250000 | 29.94 | <.0001 |
| process | 4 | 1514.94000 | 378.735000 | 47.19 | <.0001 |
| Age*process | 4 | 190.300000 | 47.575000 | 5.93 | 0.0003 |
- To obtain the coefficients for the contrast, set up a two-way table as shown below: use the first variable on the CLASS statement as the ROW variable (Age) and the second variable on the CLASS statement as the COLUMN variable (Process). Sort the levels of the variables alphanumerically, as shown.
| Age | Process | |||||
| Adjective | Counting | Imagery | Intentional | Rhyming | ||
| Older | ||||||
| Younger | ||||||
- Next fill in the body of the chart with coefficients for the comparison of interest: compare the IMAGERY method (averaged over Older and Younger) to the INTENTIONAL method (also averaged over Younger and Older).
| Age |
Process |
|||||
| Adjective | Counting | Imagery | Intentional | Rhyming | ||
| Older | 0.5 | -0.5 | ||||
| Younger | 0.5 | -0.5 | ||||
- Label the last column and last row as 'Marginal'. Then fill in the blank cells within the body of the chart with zeros.
- Lastly, sum across the rows and down the columns to obtain the marginal coefficients.
| Age |
Process |
|||||
| Adjective | Counting | Imagery | Intentional | Rhyming | Marginal Age | |
| Older | 0 | 0 | 0.5 | -0.5 | 0 | 0 |
| Younger | 0 | 0 | 0.5 | -0.5 | 0 | 0 |
| Marginal (Process) | 0 | 0 | 1 | -1 | 0 | 0 |
The marginal coefficients provide the coefficients for the main effects: the row marginal coefficients are for the variable Age[2] and the column marginal coefficients are for the variable Process. (Note that the marginal coefficients sum to 0 in both directions.) The coefficients in the body of the chart provide the coefficients for the Age*Process interaction.
The ESTIMATE (or CONTRAST) statement would follow the MODEL statement in your call to PROC GLM with the syntax shown below. The coefficients for the interaction term are obtained by reading within the body of the table: first across row 1 from left to right, then across row 2 left to right, then row 3 left to right:
estimate 'Compare Imagery to Intentional Memorizing (both averaged over age groups)' Age 0 0 Process 0 0 1 -1 0 Age*Process 0 0 0.5 -0.5 0 0 0 0.5 -0.5 0; |
The high p-value indicates that not enough evidence is present to reject the null hypothesis that vivid imagery and intentional memorization result in the same number of words recalled. Although the two methods do not differ significantly in the number of words recalled, vivid imagery may result in more interesting study sessions!
| Parameter | Estimate | Standard Error | t Value | Pr > |t| |
| Compare Imagery to Intentional Memorizing (both averaged over age) | -0.15000000 | 0.89585465 | -0.17 | 0.8674 |
To learn more, take our Statistics 2: ANOVA and Regression training course.
[1] (Howell, D. C. (1999). Fundamental Statistics for the Behavioral Sciences, 4th Edition. Duxbury Press, Pacific Grove, California.
[2] Since the coefficients for Age are both zero, Age may be omitted from the ESTIMATE statement.

8 Comments
I have a very general question regarding this topic:
Most textbooks only deal with contrasts and not with more general linear combinations of the means. SAS, as well as other software, has a special statement for contrasts next to the estimate statement.
It is not clear to me why contrasts are so popular and deserve special treatment compared to more general linear combinations of the means. Has this to do with estimability? With the existence of orthogonal contrasts? Is this because pairwise comparisons are contrasts? ...
Pingback: URL
I'm puzzled as to why you would fit the interaction model in order to extract a main effect contrast. If the interaction term is in because process differences depend on age, then there is little point in averaging over age. But if there is no interaction, then you want the process difference from the model without interaction. For balanced data not such an issue if you want results for exactly 50% younger, 50% older, but for unbalanced data or to reflect the actual age frequencies, could not your result be misleading?
Great question—thanks for asking. We are interested in the main effects, but PROCESS differs significantly by AGE, so we have to include the interaction term in the model. The table that was used to calculate the coefficients for the ESTIMATE statement is the table for the least-square means. These were then translated into coefficients for the model parameters. LS-means are predicted population margins; as you point out, they estimate the marginal means under the assumpgion of a BALANCED POPULATION. If the populations are highly unbalanced, you would want to include that information and interpret your results with caution. It may then be more advisable to ask questions WITHIN each age group.
As it turns out, this study is a balanced one with equal sample sizes for all possible treatment combinations (see frequency table below). That would have been good information to include originally, so thanks for raising this important issue.
TABLE OF AGE BY PROCESS
Age Process
Frequency Adjective Counting Imagery Intentional Rhyming Total
Older 10 10 10 10 10 50
Younger 10 10 10 10 10 50
Total 20 20 20 20 20 100
In the presence of the interaction of AGE and PROCESS, it is appropriate to make comparisons within levels of age and within levels of process. The SLICE option on the LSMEANS statement creates these tests of "simple effects".
proc glm data=recall;
class age process;
model words=age|process;
lsmeans age*process / slice=age slice=process;
run;
quit;
The slice option provides test for PROCESS within each level of AGE and tests for AGE within each level of PROCESS. This first table is "sliced" by age, providing tests within the older and younger groups. The results indicate that the processes differ significantly within each age group. .
Age*process Effect Sliced by Age for Words
Age DF Sum of Squares Mean Square F Value Pr > F
Older 4 351.520000 87.880000 10.95 <.0001
Younger 4 1353.720000 338.430000 42.17 <.0001
The second table indicates the presence of significant age differences within all process EXCEPT for counting and rhyming.
Age*process Effect Sliced by process for Words
process DF Sum of Squares Mean Square F Value Pr > F
Adjective 1 72.200000 72.200000 9.00 0.0035
Counting 1 1.250000 1.250000 0.16 0.6940
Imagery 1 88.200000 88.200000 10.99 0.0013
Intentional 1 266.450000 266.450000 33.20 <.0001
Rhyming 1 2.450000 2.450000 0.31 0.5820
Pingback: “Easy button” for ESTIMATE statements - The SAS Training Post
I can never figure out how to write contrasts correctly, but that makes it much more clear, thanks!
HI Max--I'm glad this is helpful for you! We started with the most difficult kind of ESTIMATE statement and will have a couple of follow-up blogs on some easier ones soon.