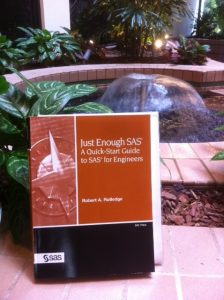
 Robert Rutledge's book Just Enough SAS is the source of this week's SAS tip. It would be easy to turn almost any page of Robert's book into a stand-alone tip. However, today my attention was drawn to two side-by-side pages. One features a PROC GCHART pie chart (and includes a DONUT statement) and the other is on PROC GPLOT and bubble plots. As someone who comes from a liberal arts background, these two looked particularly appealing and SAS user friendly. The bubble plots obviously won this time!
If you find today's SAS tip useful, I'd strongly encourage you to visit Robert's author page. There's some great info there. You'll find free resources including a full chapter from the book, a bonus excerpt, and a link where you can download the SAS conference papers mentioned in his "About This Book" section. Also, you can read a previously featured tip from Robert Rutledge on PLOT and PLOT2 Statements in this blog post.
The following excerpt is from SAS Press author Robert Rutledge's book "Just Enough SAS: A Quick-Start Guide to SAS for Engineers" Copyright © 2009, SAS Institute Inc., Cary, North Carolina, USA. ALL RIGHTS RESERVED. (please note that results may vary depending on your version of SAS software)


2 Comments
Some of the most popular hits on my blog are about bubble plots:
Basic:
http://sas-and-r.blogspot.com/2010/03/example-728-bubble-plots.html
Colored by a fourth variable with 2 levels:
http://sas-and-r.blogspot.com/2010/03/example-729-bubble-plots-colored-by.html
Colored by a fourth variable with more than 2 levels:
http://sas-and-r.blogspot.com/2010/09/example-85-bubble-plots-part-3.html
Note that the last of these is more complicated-- it relies on annotate data sets, not just proc gplot.
Hi Ken, thanks so much for reading and for sharing your examples!