Business Problem: The traffic lighting (red/green/yellow) range is different for one group/category than the others but the indicator needs to include all group values.
Recommendation: It's all in the data.
Here is an example. For the Candy_Sales_Summary data (located in the EG Sample Data folder) there are three groups of customers. The distribution of revenue within the retailer group is significantly higher than the other two groups, therefore the range is different. The table below includes the executive's defined red/yellow/green ranges for each group.
| Type | Revenue (Million) | Range (red, yellow, green) | Result |
| Grocery | $9.7 | <10, 10<15, 15+ | Red |
| Retailer | $46.82 | <40, 40<60, 60+ | Yellow |
| Wholesale | $18.59 | <10, 10<15, 15+ | Green |
Step 1. Update the data source to include a calculated range result based on the different groups.
You can do this any number of ways. For this example, I just used a quick sql statement and data step to get the 1, 2, 3 result based on the above criteria.
proc sql;
create table vals as
select
type,
sum(sale_amount) as rev format=dollar12.
from egsample.candy_sales_summary
group by type;
quit;
data bid.typeind;
set vals;
if type = 'Retailer' then do;
  if rev/1000000 < 40 then ind=1;
  else if 40 <= rev/1000000 < 60 then ind=2;
  else ind=3;
end;
else do;
  if rev/1000000 < 10 then ind=1;
  else if 10 <= rev/1000000 < 15 then ind=2;
  else ind=3;
end;
run;
The resulting data table has three columns, the type, revenue value and the indicator number.
| type | rev (in mil) | ind |
| Grocery | $9.7 | 1 |
| Retailer | $46.82 | 2 |
| Wholesale | $18.59 | 3 |
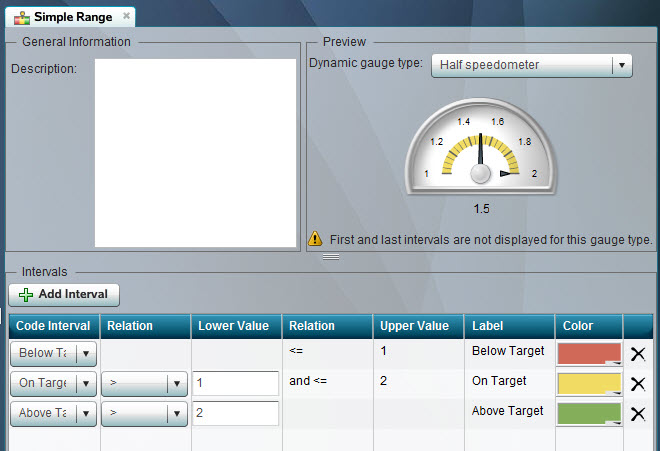
Step 2. Create a BI Dashboard Range to convert the calculated range into color categories.
In BI Dashboard, only one range can be applied to the indicator display therefore we need to create a simple range of 1, 2, 3 and use ETL code to derive the range on the data table.
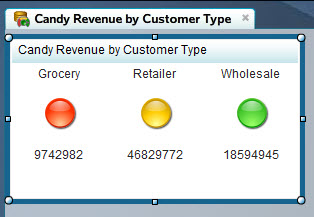
Step 3. Generate an indicator
Included is a sample indicator that uses the updated data source (from step 1.) and the range (created in step 2.). Note that I modified the data definition to use the variable REV as the label for the data in IND. Otherwise the numbers displayed would be 1, 2, 3.


10 Comments
Hi Angela-
I am new to the BI dashboard, and I was wondering in step 3 where you modified the data definition to use the variable REV as the label for the data in IND, did you simply apply a format to the indicator column and label it as the REV? or how were you able to accomplish this?
In Step 3, I used the indicator properties (found on the right side of the BI Dashboard web application - after selecting the indicator) and chose REV as the data element in the label drop down box and the IND data element as the data drop down selection.
Hope this helps. Otherwise, a screenshot followup might be in order.
Ok my dashboard properties must be a little different. I dont have the drop down for label. I was able to get it to work by defining a format within EG before pulling the data into dashboard. Does this dynamic range also work with gauges or does this just work with the lights?
Great news Nicole.
The dynamic 'colors' will work with any indicator that uses a range.
Pingback: Customize the bar chart color palette in BI Dashboard
Thank you for the tip, it's very interesting!
Hello Angela,
Really Interesting Blog. But it would be really helpful if you can guide me through the following scenario.: I have a dataset which is having the range values . But now I want ranges to be defined on the basis of the dataset. i.e I want to include dataset values as ranges in dashboard.It should automatically retrieve the values without having me to manually type the values of ranges..
If there is a possible solution please let me know via mail.
At this time, the ranges must exist within the range definitions in BI Dashboard. The workaround I describe in the blog post is the only way around this limitation.
So The only way we can have ranges is manually inserting in the range definitions in SAS BI Dashboard..We just cannot automate the Process.
One More Question which I've encountered is how to get a prompted filter in SAS Bi Dashboard..
Calculating the result of the indicator within the data is the workaround to loading/automating range definitions in BI Dashboard.
For the 2nd question - use a Dynamic Prompt and create an interaction between that and the indicator it will change. Prompted filters will also be covered in my upcoming book "Building Business Intelligence Using SAS: Content Development Examples". It will be available for purchase in only a few short weeks :)