 Rick Wicklin created a nice example of using the SURFACEPLOTPARM statement to create a surface plot in SAS. As I read it, the question that immediately came to mind was: can I use this to create the famous SAS cowboy hat?
The "cowboy hat" is a highly distributed example of using PROC G3D to create a 3-dimensional rendering of data that resembles...well...a cowboy hat. PROC G3D is a cool SAS proc, but it's part of the SAS/GRAPH product and not everyone has access to that. For example, users of the SAS OnDemand for Academics cannot run PROC G3D or any SAS/GRAPH programs. But the SG procedures, including SGPLOT and SGRENDER, are built into Base SAS.
Now we can bring the cowboy hat to the next generation of SAS users. Without further ado, here is the SAS program that build the hat. The program works in SAS Display Manager, SAS Enterprise Guide, and SAS OnDemand for Academics.
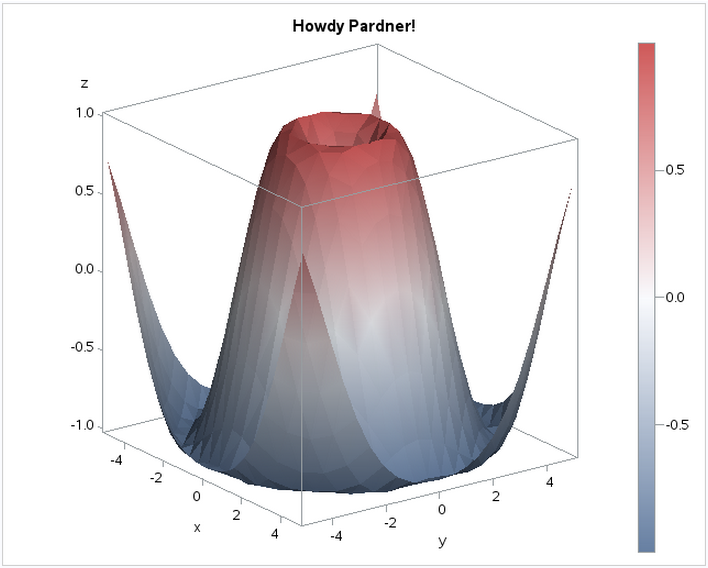
/* Graph Template Language that defines the graph layout */ /* This needs to be run just once within your SAS session */ /* From Rick's post at: */ /* https://blogs.sas.com/content/iml/create-surface-plot-sas */ proc template; /* surface plot with continuous color ramp */ define statgraph SurfaceTmplt; dynamic _X _Y _Z _Title; /* dynamic variables */ begingraph; entrytitle _Title; /* specify title at run time (optional) */ layout overlay3d; surfaceplotparm x=_X y=_Y z=_Z / /* specify variables at run time */ name="surface" surfacetype=fill colormodel=threecolorramp /* or =twocolorramp */ colorresponse=_Z; continuouslegend "surface"; endlayout; endgraph; end; run; /* DATA step to create the "hat" data */ data hat; do x = -5 to 5 by .5; do y = -5 to 5 by .5; z = sin(sqrt(y*y + x*x)); output; end; end; run; ods graphics / width=1000 height=800; /* And... Render the Hat! */ proc sgrender data=hat template=SurfaceTmplt; dynamic _X='X' _Y='Y' _Z='Z' _Title="Howdy Pardner!"; run; |

4 Comments
Yee haw! And here's the contour plot version of the cowboy hat. However, the contour plot does not provide protection from sun or rain.
May need to let Jan know to update his headwear! ;-) https://twitter.com/metacoda/status/592104613018492929
How does SAS Asset Performance Analytics models recognise anomalies in equipment performance?
Wow, great question. Here's a link to the product fact sheet, which might help.
Briefly, I can say it works like this. You have a huge amount of historical data (gathered from a data historian like OSISoft PI), and you have records of past incidents that caused maintenance or downtime. The product brings this data together to help you create specific analytical models that can predict when such incidents are at risk of happening again. SAS Asset Performance Analytics supports acquiring this data, developing, training, testing the models, and then putting the results into operation.
For more details, visit the product page on SAS.com.