Recency, Frequency, and Monetary Analysis (or RFM) is a popular customer segmentation technique employed by database marketers everywhere. Marketers use RFM to identify which customers are most likely to respond to a direct marketing campaign. The model takes into account three simple metrics:
- How recently did the customer buy from you?
- How frequently does the customer buy something from you?
- How much money does the customer spend on your products?
Each metric receives a value of 1 through 5. The result is 125 "bins" of customers (because 125 is 53). Those with higher RFM scores are considered more likely to respond to a campaign...potentially.
For years, SAS customers have used special tools like SAS Enterprise Miner to compute RFM. With SAS 9.4, the RFM algorithms are built into Base SAS, and there's an easy-to-use task in SAS Enterprise Guide. (The task is also available in the SAS Add-In for Microsoft Office.) You can find the task in the menus at Tasks->Data Mining->Recency, Frequency, and Monetary Analysis.
Note: To use the task, you must have SAS 9.4 and SAS Enterprise Guide 6.1 (or SAS Add-In for Microsoft Office 6.1). Despite the "Data Mining" category, this task does not require SAS Enterprise Miner.
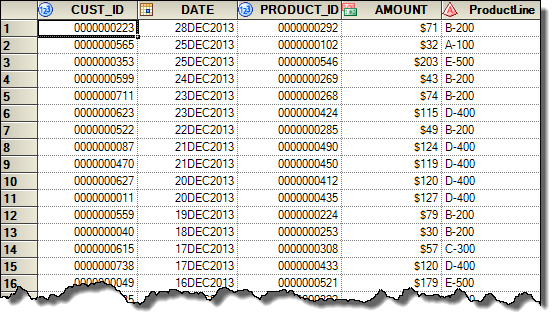
As an example, suppose you have transaction data that looks like the following. You need only the 3 fields -- a customer ID, a transaction date, and a transaction amount (value):
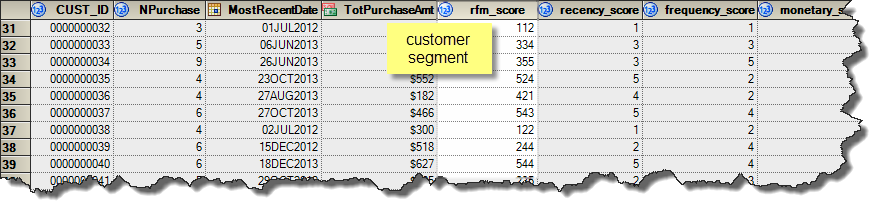
From this, RFM calculates "scores" for each customer. The customers with the highest scores will probably be those that spent the most with you, across the most recent and frequent dates. The idea behind RFM is that a minority of customers are responsible for a majority of your business. RFM scores provide visibility into who those valuable customers are. Here's an example of the scored data, summarized at the customer level:
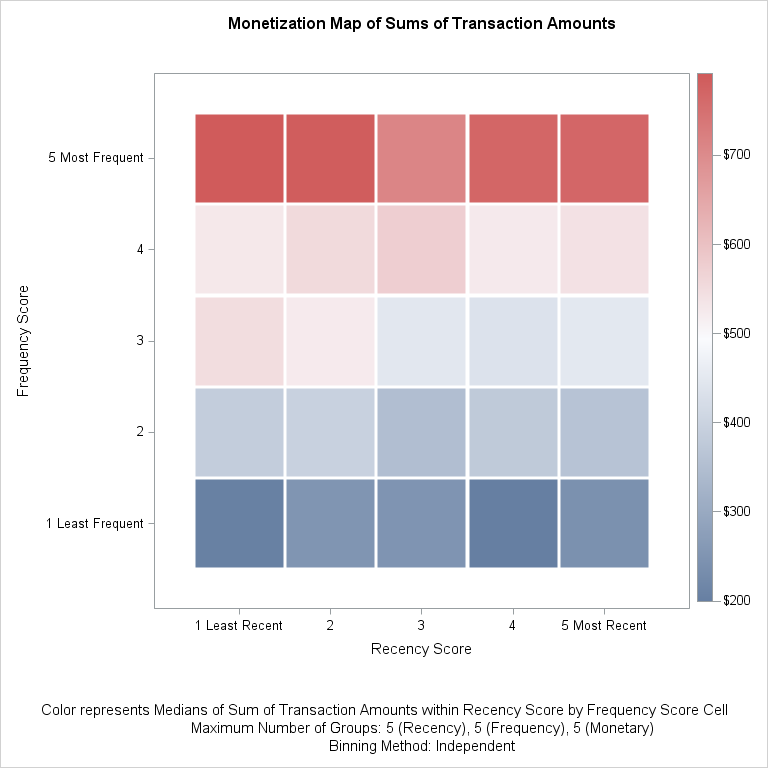
The RFM task supplies several useful charts. Here's a "monetization map", which summarizes the monetary values for each combination of frequency and recency scores. You might use this to help identify a "sweet spot" of customers that you want to target.
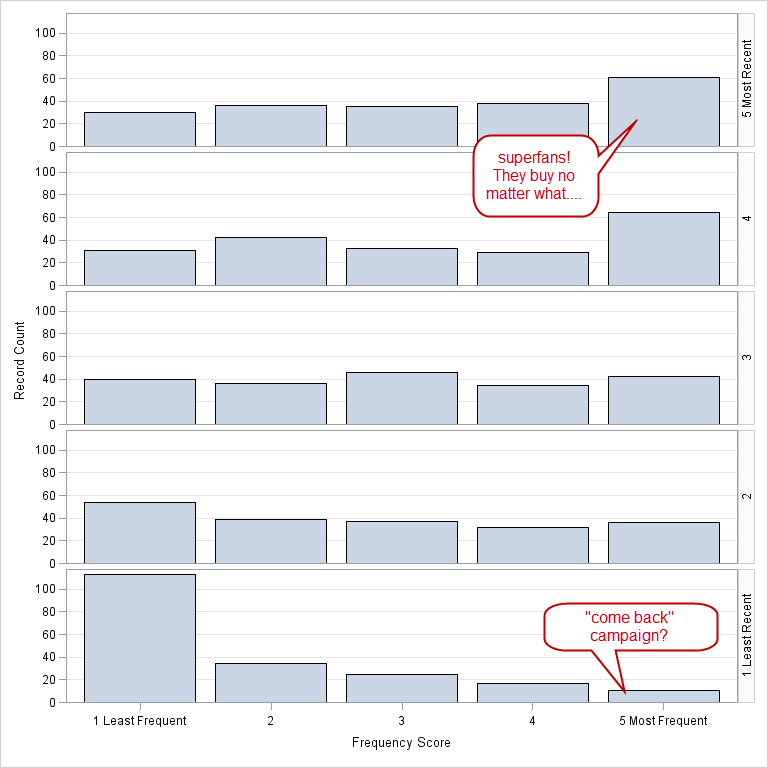
Next, let's look at a paneled bar chart of the Frequency by Recency segments. The bar on the lower right corner indicates that there are a handful of customers who made several purchases in the past (high frequency), but that was a long time ago (not recent). Perhaps that's a good target segment for a "Come back and see us -- we miss you" campaign. Contrast this with the bar on the upper right, which shows the 60 superfans: the customers who bought lately and often. You can decide whether to "go back to the well" with this group in the next campaign, or save the campaign expense as they might buy from you anyway, without prompting.
RFM scores are just one small part of planning a campaign. The "Recency, Frequency, and Monetary Analysis" task is a good start, but eventually you might want to factor in other criteria.
After all, direct marketing has many nuances, such as cross-referencing with opt-out lists and taking steps to avoid "overmarketing" to any one segment. Tracking response rates, testing campaigns, and the actual campaign workflow are also essential elements. When you're ready, SAS Customer Intelligence offers an integrated set of applications for all of these aspects.

13 Comments
Chris - Great to hear that RFM segmentation is available in SAS 9.4 Base SAS. I have a couple follow-up questions.
First, is there an option in the procedure to choose a different number of bins? For example, we generally only use two values ('high' and 'low') for each metric resulting in 8 bins versus the 125 bins you describe in the article. We have found that 8 bins are more manageable from a strategy standpoint, especially during the initial analysis.
Second, is there functionality to create an output with summary statistics for each bin? We calculate % customers, % sales, transactions/customer, sales/transaction, & sales/customer by bin to summarize what each bin looks like; this serves as our 'one-page-summary' when discussing strategy implications.
Thanks,
-Lee
Lee,
Yes, the RFM task allows you to specify from 1-9 bins for each metric. If I make these adjustments for the example I presented, I get a much-simplified result - (click to see example).
You can specify different aggregation methods to calculate the metric: sum (the default), mean, median, and maximum. I didn't mention it in the post, but you can also supply presummarized data (at the customer level) instead of transaction-level data, so you have even more control over the raw input for these measures.
Since part of the output is a data set with all of the scores, you can add a Summary Statistics step (or some other summary/query) to easily produce the summaries that you want. The output includes the customer ID, so you can use the Query Builder to join that back with whatever customer details you want to include in a report.
For some reasons I'm unable to complete the Recency, Frequency, and Monetary Analysis in SAS EG 7.1.
My sample data is as follows. It is customer data.
conkey rec_pur Total_bal no_prods
1000000 1/1/1946 712.09 1
1000001 5/1/1992 26036.74 2
1000002 6/19/2007 105747.2 10
1000005 7/24/2000 41.99 2
Here conkey,Total_bal and no_prods is numeric variable. rec_pur is SAS date format.
Can someone advise the likely workaround or solution to come past this issue?
Log below:
05:35 Friday, March 13, 2015

20         ;
NOTE: Writing TAGSETS.SASREPORT13(EGSR) Body file: EGSR
21
22         GOPTIONS ACCESSIBLE;
WARNING: Apparent invocation of macro AARFM not resolved.
23
24
25         %aaRFM;
           _
           180

ERROR 180-322: Statement is not valid or it is used out of proper order.

WARNING: Apparent invocation of macro EM_RFM_CONTROL not resolved.
26         %EM_RFM_CONTROL
           _
           180
ERROR 180-322: Statement is not valid or it is used out of proper order.
Although I posted this question in SAS community https://communities.sas.com/message/265083#265083, I didn't get any positive response.
Please help.
Looks like you have received some responses now in the community. SAS 9.4 includes the necessary RFM code/macro with Base SAS. If you're running with a version of SAS earlier than that (even SAS 9.3), then you would see the error that you shared.
Pingback: How to reactivate your churned customers
Pingback: Making the case for algorithmic digital attribution
Pingback: omni-channel marketing
Pingback: Algorithmic marketing attribution and conversion journey analysis [Part 1] - Customer Intelligence Blog
I'm using SAS guide entreprise 4.3 that there is not tasks->datamining->RFM analysis. So how can i do RFM segmentation in this version by using SAS code or macro
Thanks
Rayen, You can run the macro directly (see this communities article). But the macro is provided with SAS 9.4 (Base), so you need that level of SAS. It should work in SAS University Edition if you want to try it there.
Thnaks so for SAS guide entreprise 4.3 there is not a way to do it !! ?
No, not using the SAS-supplied RFM feature. However, SAS users have been creating their own simpler RFM methods for years. See this example. And check the conference paper archives for other ideas.
Pingback: 알고리즘 기반의 분석적 마케팅 기여도(Algorithmic Marketing Attribution) 측정을 통한 360도 마케팅 인사이트 - SAS Korea