Tag: visual analytics

Data Management
Leo Sadovy 0
To BI and beyond: A BI primer

I remarked in an earlier post (“BI and Better Decisions”) that, prior to joining SAS, while I understood analytics and performance management just fine, the phrase ‘business intelligence’ was not in my vocabulary”.  Turns out I’m not the only finance professional so inflicted.  I was invited last week to give a

Don Chapman 2
How to create geographic visualizations

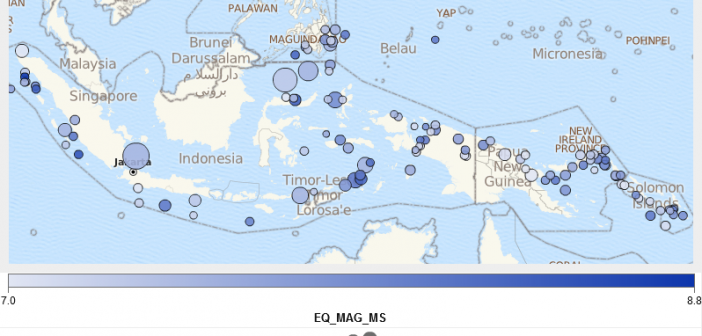
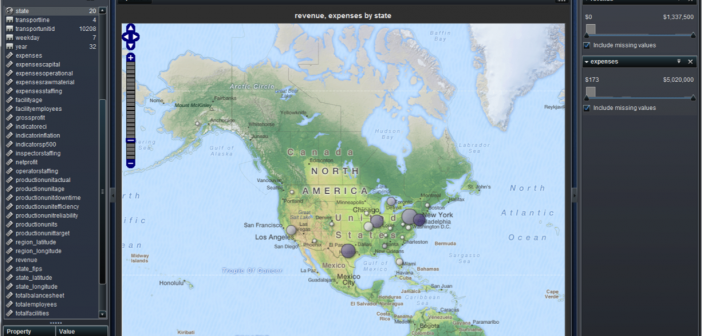
Today I want to focus on geographic visualizations in the SAS Visual Analytics Explorer. Geography-based data can be explored and visualized in a variety of ways. Tables, crosstabs, tree maps, bar charts can all be used, but displaying the information on a geographical map is often the most meaningful way

Gail Bamford 0
Is high performance analytics exactly what government agencies need to help with big data?

SAS Solutions Architect David Pope recently held the audience’s attention at the SAS Government Executive Leadership Summit, where he helped demystify high-performance analytics for the government crowd in attendance.   His presentation entitled, “The Next Big Thing: High-Performance Analytics” reviewed how the analytics lifecycle can be greatly accelerated with recent technological

Leo Sadovy 5
Surfing the disturbance

The future of business is the martial arts CEO, the jujitsu strategist.  Far too many organizations approach business with an American football mentality, complete with scripted plays, huddles and time outs, but the real world isn’t quite so convenient and accommodating.  The real business world is 7x24 with no time outs

Anna Brown 0
How to visualize before you model big data

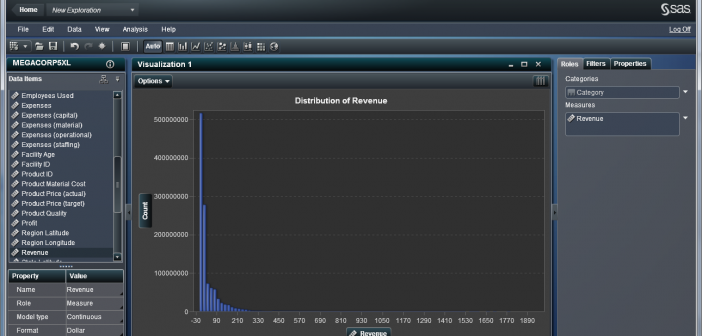
"Nobody knows analytics the way SAS does," said SAS CEO Jim Goodnight in my recent interview with him. He also explained the significance of being able to visualize and explore "big data." With visual analytics, you can cruise a billion records and just do graphs and plots one after the

Alison Bolen 2
12 questions to ask your big data vendor

Seems like the industry is getting hit with a new analytics solution for "big data" every couple of weeks. With every database vendor and analytics provider jumping into this space, we wanted to offer a checklist of questions for you to ask – so you can start differentiating between the

Analytics | Risk Management
Leo Sadovy 8
Conversational analytics

When you begin your career your most important skills are your hard, technical skills; the finance and accounting, the statistics and economics, the physics and chemistry, the engineering and calculus.  But as I tell my business school mentees, as your career progresses, the emphasis changes such that much sooner than

Analytics
Jennifer Marchi 2
So many WOWs…in so little time

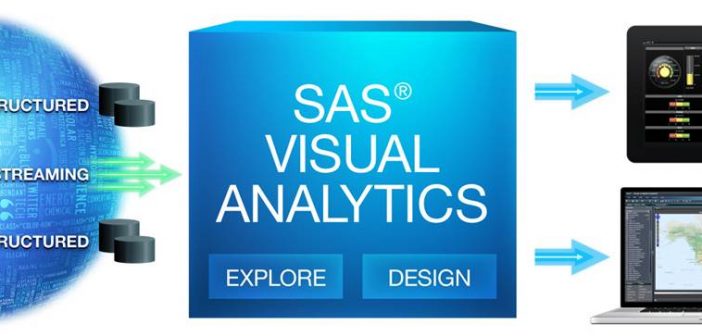
I remember the first time I saw a Cirque du Soleil® performance—the artistry, the split-second timing, that repeating sense of WOW.  I was an instant fan. Funny… but I got that same sense of awe the first time I saw a demo of SAS® Visual Analytics.  I’d read the project

1 10 11 12