What is a tree map? What do the sizes and colors in the tree map measure? This great introductory demo explains how to build a tree map, when you might want to use this type of data visualization, and how to drill down into tree map data. You can also
Tag: visual analytics
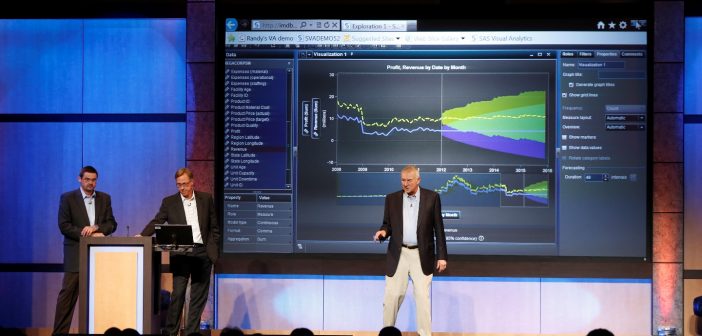
"What do you do when you first get a data set that's a billion rows long?" asks SAS CEO Jim Goodnight. "You want to play around with it." At dozens of SAS events over the last year, audience attendees have watched Goodnight do just that, quickly grabbing 1.15 billion records, selecting

Our recent innovations into Data Visualisation have led us to be inundated and involved in lots of conversations with customers and prospects looking to benefit from the marriage of advanced analytics, visualisation, data management and simplicity. Greg and Minh delved into the benefits that this marriage can yield and why data visualisation should form an

Remember that video we posted recently with Kimberly Holmes of XL Insurance? In it, she says the demo she saw about a fake toy company using SAS Visual Analytics sparked so many new ideas for her that she wished she had a tape recorder in her brain to capture them

There are numerous algorithms used in forecasting, and each of those algorithms is optimized for a certain class of data. How does a business analyst know which forecasting algorithm to use? With the new version of SAS Visual Analytics, you don’t have to know – the product does all the
What makes your business more successful? According to Kimberly Holmes, Senior VP of Strategic Analytics at XL Group plc, “Our success is about asking more questions and finding out the answers." If that's the case with your business too, you need tools to help you ask more questions and explore many

To read more ongoing tips and insights for small and midsize businesses, follow our SAS4SMB blog series or visit SAS for Small and MidSize Business. Data underpins the operations and strategic decisions of every business. Yet these days, data is generated faster than it can be digested, making it challenging

Organizations must find the right balance between tactical use of their data and strategic use of their data. The following statement encapsulates the difference between an application that was primarily designed from a tactical perspective versus a strategic one.: "Thanks, you delivered what I asked for (tactical), but not what I

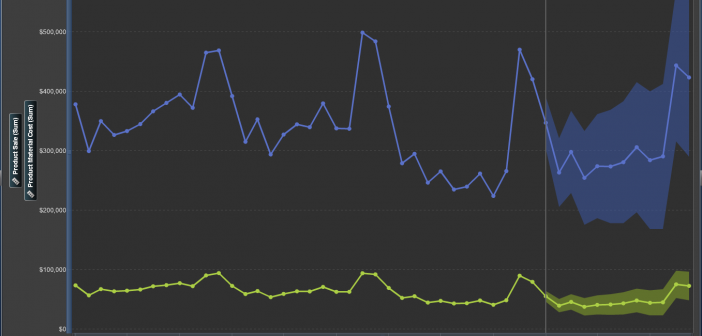
In case you are wondering, yes, I am reusing the same graphic from last week, but this time to make a contrasting point. Last time, in “The Skeptical CFO” I was focused on the VARIABILITY in the data and the forecast. This week, however, we’re headed in the opposite direction,

When SAS CEO Jim Goodnight talks about the development of SAS High-Performance Analytics, he always starts with the customer. After all, it was banking customer UOB in Singapore that first approached Goodnight three years ago about reducing the time it took to calculate risk factors on the bank's full portfolio.


