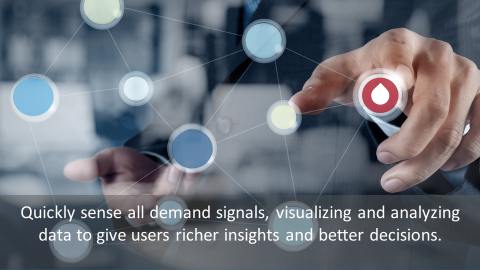
"Tap into all your demand signals. Organize. Visualize. Analyze. Predict. Orchestrate. Optimize."
 The availability and collection of data are compelling companies to invest in demand signal management solutions to take advantage of the vast amount of information to support their planning processes. However, many have not gotten the return on their investment, and others are realizing that the real value is in visualization, exploration and predictive analytics.
What is demand signal management?
Demand signal management is essentially a demand signal repository (DSR), which is a centralized database that stores, harmonizes and normalizes data attributes and organizes large volumes of demand data for use by decision support technologies. Demand sensing is the translation of downstream data with minimal latency to understand what is being sold, who is buying the product (attributes), and the impact of demand-shaping programs. These demand elements can be translated to uncover insights and predict future demand. A great example of a demand signal repository is the new SAP Demand Signal Management solution, also known as DSiM. DSAs like SAS® Demand Signal Analytics (certified to run in Hana) can sit on top of SAP DSiM in the Hana environment, lift data in memory, visualize the data with high-resolution graphics, explore the data, and then run predictive analytics to uncover actionable insights. Upon completion of running the analytics, the data is dropped back into DSiM. There is no need to load additional SAS tables (see Figure 1).

Why is this so important?
Companies can uncover consumer insights, use predictive analytics to measure and influence consumer behavior, and more accurately understand demand to improve forecast accuracy. Not only to sense what is happening within the market, but also to keep a pulse on market trends and competitive activities, gauge changes in demand, analyze buying trends, and then respond quickly and profitably to synchronize supply and demand. The successful implementation of a demand signal repository, supercharged by demand-signal analytics, is dependent upon managing POS and syndicated scanner data effectively, and complementing it with specific internal data, such as the company’s product hierarchy and transactional data. Normally this information comes from internal corporate systems, local repositories and spreadsheets.
So what is demand signal analytics (DSA)?
Demand signal analytics uses the combination of visual analytics and predictive analytics designed to explore and access the data in DSRs to uncover actionable insights. You can think of DSA as comprising three layers. The foundational layer is a demand signal repository (DSR) – an integrated database of essential (big) data you need to provide insight into sales, marketing, inventory, price, demand performance and operations. It cleanses, normalizes, and integrates this raw demand data from any source. It works with any data type or source format from multiple retailers, distributors and their respective disparate systems to make that data available for retrieval, query, reporting, alerts and analysis.
The second layer uses visual analytics to transform the DSR data into demand signal visualization (DSV) to allow for exploration, analysis and insight that suggest areas of focus, improvement and action. While typical marketing research only provides answers to predefined questions, DSV provides insight into questions you didn’t initially know to ask. The third layer brings the DSR and DSV to culmination by combining DSR and DSV, creating “demand signal analytics" (DSA). The addition of predictive analytics (forecasting and optimization) complements the descriptive analytics of DSV, and quantifies the direction, size, scope and variability of supply chain replenishment.
Key benefits
- The ability to optimize data management no matter the source. Always have access to the data you need, from legacy systems to ERP applications to data stored in SAP Hana or Hadoop, from virtually any hardware platform or operating system. New sources can be easily added and security is centrally managed at the user, department or enterprise level. Companies will get improved productivity using a standard interface for building and documenting work. The result is consistent, timely data that leads to improved accuracy and confidence.
- Unlock insights with visual data exploration, which will give companies a competitive advantage and make better, more effective decisions using all of their strategic data investments. The visual analytics component empowers business users to conduct thorough exploration on all available data quickly without requiring them to know subsetting or sampling techniques. By using all of the data available, users are able to clearly view all options to make more accurate decisions faster.
The entire organization can take advantage of the predictive intelligence of DSA by easily visualizing big data libraries of facts and measures at the lowest granularity across account hierarchies, category/item hierarchies and geographical hierarchies. In addition, DSA can deliver targeted alerts to enable exception-based processes and workflow. Finally, most DSAs should come with a set of pre-packaged reports, dashboards, and easy-to-use exploration capabilities designed to support demand management, brand management, category management and product performance, along with scorecarding capabilities that accelerate time to value. The transformation from DSR to DSV, and ultimately DSA, will require leadership, a strategic vision, a road map of priorities, and the ability to execute against the organization’s strategy.
Are you getting the most out of your demand signal management solution?
Read more about demand signal analytics.