 For thousands of years, the human experience has been recorded by storytellers. Stories tell the tale of our lives: beginning, middle and end. Stories document the triumphs and tragedies of heroes and villains and everything in between. Human beings are storytellers -- it's a trait as uniquely human as an opposable thumb.
But the ways in which we tell stories have changed. Storytellers began with pictures carved onto cave walls. Written language later allowed the poets, playwrights and philosophers of Greece to document the human experience in much greater detail. Gutenberg’s advances in printing made it possible to mass produce books, ushering in a new era of storytelling. Photography in the 19th century, moving pictures in the 20th century – first silent, then with sound, and finally today's Internet have all radically changed the way we tell our stories.
But the newest tool in the storyteller’s toolbox is one that might, at first, seem out of place: Data.
What are numbers doing here? Stories are told with words and pictures, not numbers and math. But increasingly it's data and the insights from that data that tells the story of our lives.
Right now, we're in the middle of a story about some of our favorite sports stars -- American football players affected by brain injuries. We now know that despite equipment and rules, the damage done by hard hits has had serious lasting consequences. We know that not from watching old films of games or listening to players in interviews. We know that from the story being told with data. Not only do the data tell the story, but story about the data, itself, tells us what happened.
Right now, as we try to understand what is happening with the Zika virus, reporters are interviewing people directly affected – mothers of children who may have been harmed by the virus. But the numbers are what convey the scale of the horror. Brazil has seen an increase from about 100 cases of microcephaly per year to 3,500 in one year. That number tells the story of 3,500 families and every other person who knows them.
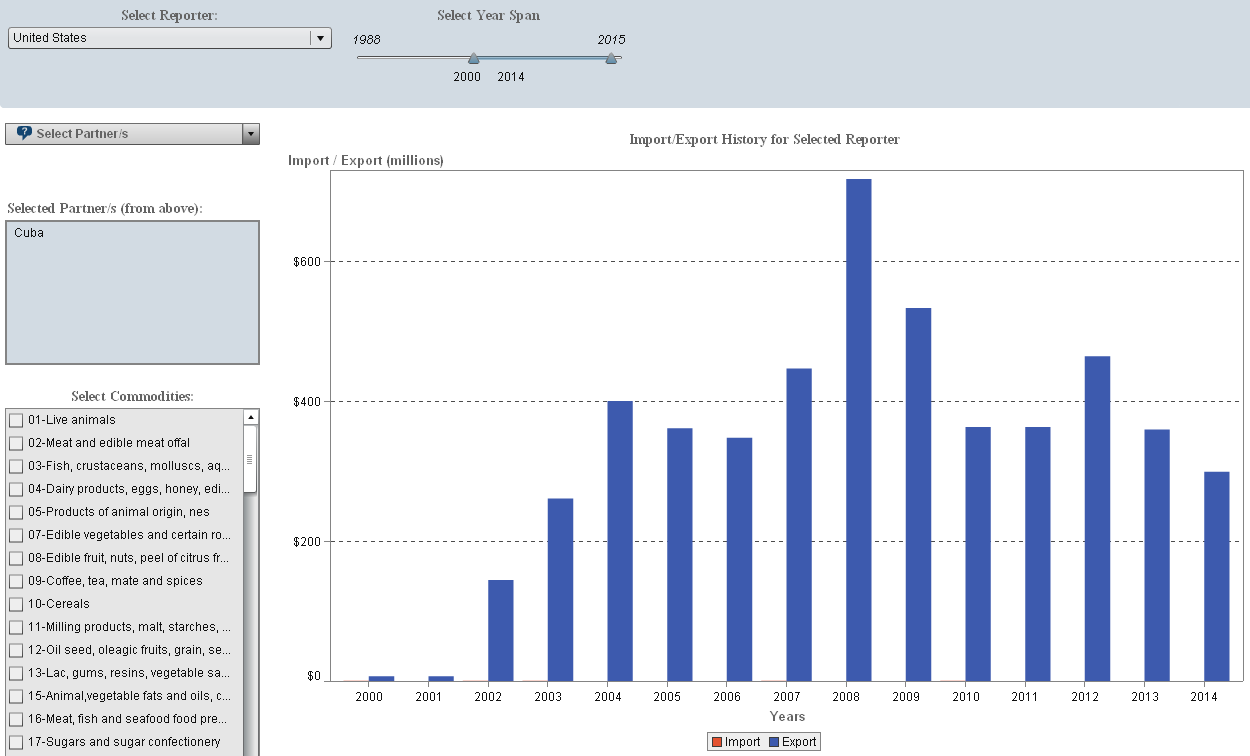
Right now, Americans and Cubans are part of developing story, a plot line that will change the lives of millions of citizens of both countries. Longstanding American trade policies in place for several generations are being set aside in hopes of building a new relationship. Politicians, journalists, and historians will tell this story their way, but data tell the story of the true complexity of American-Cuban relations. The chart below shows reported trade data between 2000 and 2014, as reported by the United States. Notice hundreds of millions of dollars of exports from the United States in blue every year and not a dollar of imports in red. Those data tell a story.
For SAS and its user community, data has always been a tool for storytelling. Data, statistics and analytic insights have always been a method for describing the human experience. People who don’t work with data on a daily basis may imagine statisticians and computer programmers are concerned only with numbers and code, but data scientists have always been storytellers. It's only now that the rest of the world is telling stories the same way we do.
That's why SAS is committed to efforts to advance data for the public good. SAS provides a platform for Project Data Sphere to assist researchers by offering the data and statistical software necessary to uncover the story of patients diagnosed with cancer. SAS hosts the Visual Analytics for UN Comtrade platform, a place to tell the story of the relationship between nations. SAS provides software for students and professors who want to learn SAS at no cost -- which helps the storytellers of today teach the storytellers of tomorrow.
Increasingly, we use data to tell stories. Data defines the beginning, demonstrates the middle and explains the end. Data describes our aspirations, accomplishments and challenges – the adventure of our lives.
No, generally speaking, data scientists don’t gather at the local coffeehouse for an open-mic night to show off their latest statistical model or data visualization. But if the poet Shelley could claim that “poets are the unacknowledged legislators of the world,” perhaps it's time for data scientists to say it: Data scientists are the unacknowledged storytellers.