Times have changed. As the oil industry shutters and sheds investments that made sense during the two-year period in which oil rode comfortably above $90, the market is establishing a new equilibrium at $40/barrel. This despite the fact that the Baker Hughes domestic rig count is down 64 percent. It’s an indication of how big the US shale oil boom was (the US Energy Information Administration reckons it was the largest expansion in American crude oil production in more than a century) – and how tenacious the year-long bust has turned out to be.
One clear indication of the current oversupply is how the price of crude reacts to news headlines. There is no doubt that a major terrorist attack as horrific as the tragic events in Paris will have serious consequences for the Middle East. In the past, any incident that increased tensions in oil-producing regions resulted in an immediate, substantial market reaction. But in the present market, oil prices did not respond with a run-up – a sign not of indifference, but of glut. With inventories full to bursting, it's news of drawdowns – rather than events that could spark supply shortages – that provides short-term stimulation in the market.
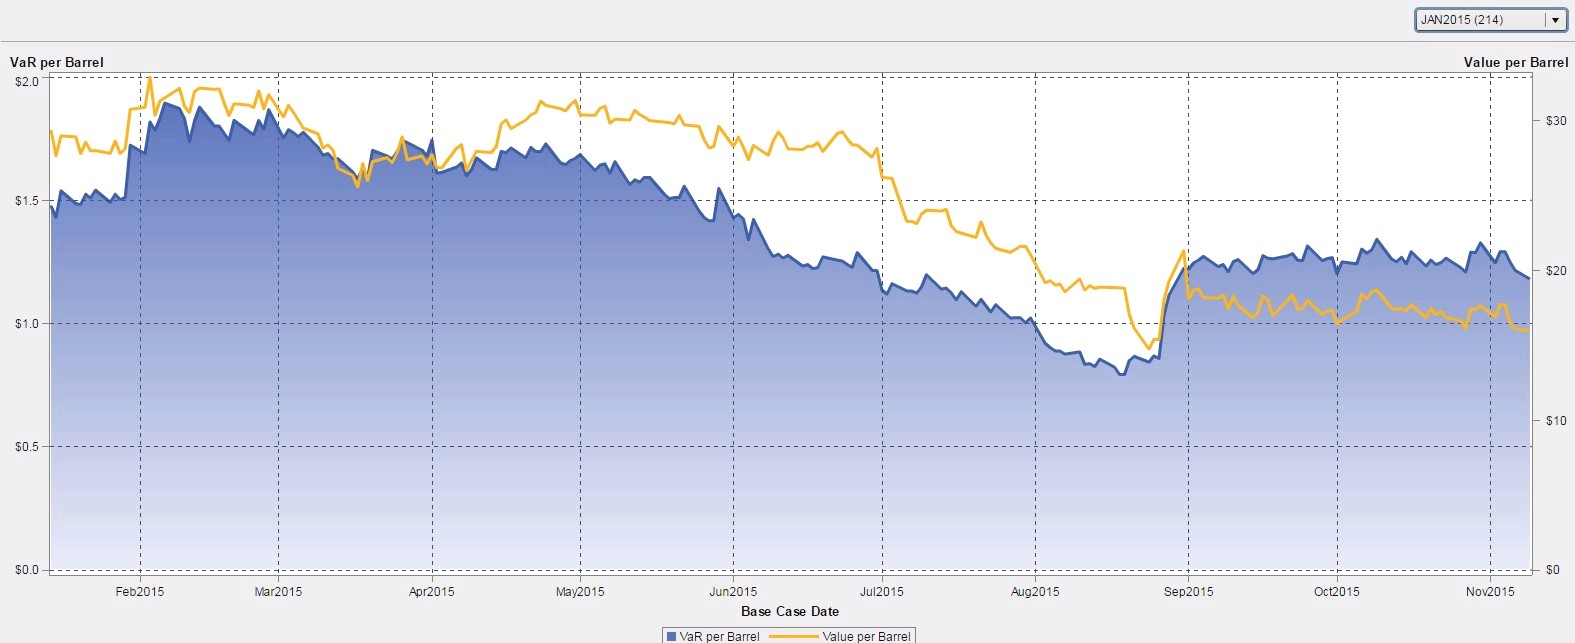
The market impact of lower volatility and tighter OPEC controls is reflected in the flatness seen in the latest VirtualOil simulation (see Fig. 1 below). Value is riding small sparks of occasional market volatility, and Value-at-Risk is closely tracking that dollar-per-barrel Mark to Market valuation. The recent decision to restructure VirtualOil at a $25 strike price means the portfolio more closely reflects many producers’ current level of operating costs. The difference is that our fictitious oil portfolio can be nimble because it's structured around derivatives, so it can generate profit in the current price environment. VirtualOil’s options are well into the money, delivering substantial positive cashflow. But many nonfictional producers’ results are saddled with additional overhead and capital expenditures, meaning they're losing money on each barrel produced.
Producers are focused on hanging in there for another year or more of lower prices. That means optimizing current production using analytics. SAS has been working with customers to use analytics to draw optimization out of the data streaming off the oilfield to create more efficient use of assets in the low-price environment.
One example is analysis of downhole sensor data in wells employing steam-assisted gravity drainage (SAGD) to produce heavy oil and bitumen. Using analytics to achieve the optimal play between injected steam and production flow can have a significant effect on the cost of producing a barrel of oil.
Spot and near-term prices have come off and there’s a steep contango on the forward curve. WTI is up $7 one year out, suggesting the market sees some upside ahead. The key word for producers is sustainability.
Assumptions
The hypothetical derivatives-based oil production firm VirtualOil simulates the performance of a generic crude oil asset, and delivers sectorial exposure to the commodity oil market. The reorganized VirtualOil structure starts up with an investment of $200MM in monthly average price call options with a strike price of $25 per barrel on the price of West Texas Intermediate (WTI) light sweet crude oil. The strip of options starts at 10,000 barrels per day and extends out for five years with a 20 percent average annual decline in underlying notional barrels, replicating a physical oil asset. VirtualOil initially holds notional crude oil reserves of approx. 10MM barrels. Monthly cash flow is generated when the daily average WTI price relative to the preceding month exceeds $25 per barrel. Cash flow is reinvested monthly at 5% and the project winds up when the reserves are depleted.
See additional simulations below. VirtualOil is managed in SAS® BookRunner with reports surfaced in SAS® Visual Analytics. Learn more about SAS® BookRunner’s state-of-the-art commodity trading and risk management capabilities.
Disclaimer: This is a fictitious portfolio and is not a solicitation to trade.